I am having trouble with part e.

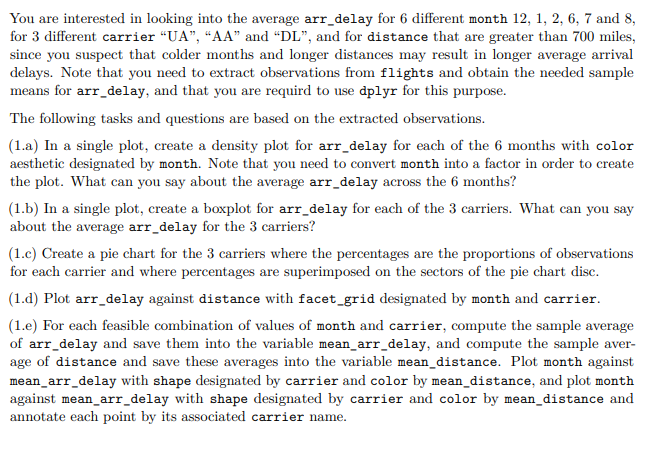
You are interested in looking into the average arr_delay for 6 different month 12, 1, 2, 6, 7 and 8, for 3 different carrier "UA", "AA" and "DL", and for distance that are greater than 700 miles, since you suspect that colder months and longer distances may result in longer average arrival delays. Note that you need to extract observations from flights and obtain the needed sample means for arr_delay, and that you are requird to use dplyr for this purpose. The following tasks and questions are based on the extracted observations. (1.a) In a single plot, create a density plot for arr_delay for each of the 6 months with color aesthetic designated by month. Note that you need to convert month into a factor in order to create the plot. What can you say about the average arr_delay across the 6 months? (1.b) In a single plot, create a boxplot for arr_delay for each of the 3 carriers. What can you say about the average arr_delay for the 3 carriers? (1.c) Create a pie chart for the 3 carriers where the percentages are the proportions of observations for each carrier and where percentages are superimposed on the sectors of the pie chart disc. (1.d) Plot arr_delay against distance with facet_grid designated by month and carrier. (1.e) For each feasible combination of values of month and carrier, compute the sample average of arr_delay and save them into the variable mean_arr_delay, and compute the sample aver- age of distance and save these averages into the variable mean_distance. Plot month against mean_arr_delay with shape designated by carrier and color by mean_distance, and plot month against mean_arr_delay with shape designated by carrier and color by mean_distance and annotate each point by its associated carrier name. You are interested in looking into the average arr_delay for 6 different month 12, 1, 2, 6, 7 and 8, for 3 different carrier "UA", "AA" and "DL", and for distance that are greater than 700 miles, since you suspect that colder months and longer distances may result in longer average arrival delays. Note that you need to extract observations from flights and obtain the needed sample means for arr_delay, and that you are requird to use dplyr for this purpose. The following tasks and questions are based on the extracted observations. (1.a) In a single plot, create a density plot for arr_delay for each of the 6 months with color aesthetic designated by month. Note that you need to convert month into a factor in order to create the plot. What can you say about the average arr_delay across the 6 months? (1.b) In a single plot, create a boxplot for arr_delay for each of the 3 carriers. What can you say about the average arr_delay for the 3 carriers? (1.c) Create a pie chart for the 3 carriers where the percentages are the proportions of observations for each carrier and where percentages are superimposed on the sectors of the pie chart disc. (1.d) Plot arr_delay against distance with facet_grid designated by month and carrier. (1.e) For each feasible combination of values of month and carrier, compute the sample average of arr_delay and save them into the variable mean_arr_delay, and compute the sample aver- age of distance and save these averages into the variable mean_distance. Plot month against mean_arr_delay with shape designated by carrier and color by mean_distance, and plot month against mean_arr_delay with shape designated by carrier and color by mean_distance and annotate each point by its associated carrier name


