

Question
I am looking to solve for the output area. All that was given initially was the input area and what to solve for in the
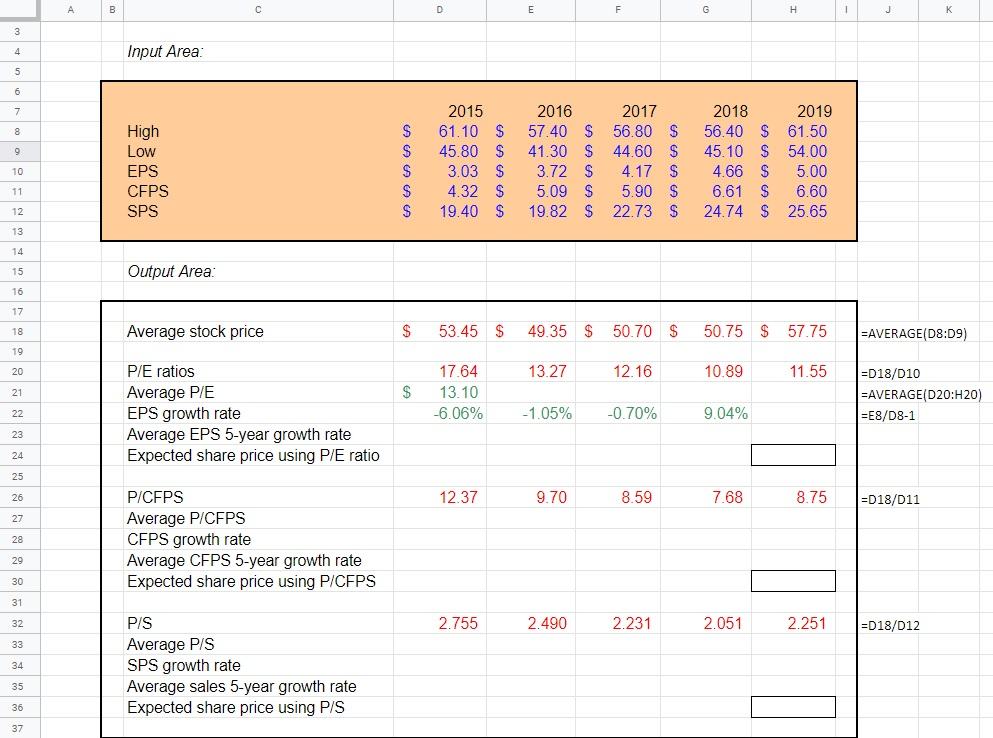
I am looking to solve for the output area. All that was given initially was the input area and what to solve for in the output area. Could someone help me solve the outputs? Additionally, is what I have done correct? The formulatext is for formulas in column D. Thank you!
Input Area: High S Low 2015 61.10 45.80 3.03 4.32 19.40 2016 57.40 41.30 3.72 5.09 19.82 $ $ $ $ $ 2017 56.80 44.60 4.17 5.90 22.73 $ $ S $ $ EPS CEPS SPS 2018 2019 56.40 $ 61.50 45.10 $ 54.00 4.66 $ 5.00 6.61 $ 6.60 24.74 $ 25.65 $ $ $ $ $ Output Area: Average stock price $ 53.45 $ 49.35 $ 50.70 $ 50.75 $ 57.75 =AVERAGE(D8:09) 13.27 12.16 10.89 11.55 $ P/E ratios Average P/E EPS growth rate Average EPS 5-year growth rate Expected share price using P/E ratio 17.64 13.10 -6.06% =D18/D10 =AVERAGE(D20:H20) =E8/D8-1 1.05% -0.70% 9.04% 12.37 9.70 8.59 768 8.75 -D18/D11 P/CFPS Average P/CFPS CFPS growth rate Average CFPS 5-year growth rate Expected share price using P/CFPS 2.755 2.490 2.231 2.051 2.251 |=018/012 P/S Average P/S SPS growth rate Average sales 5-year growth rate Expected share price using P/S Input Area: High S Low 2015 61.10 45.80 3.03 4.32 19.40 2016 57.40 41.30 3.72 5.09 19.82 $ $ $ $ $ 2017 56.80 44.60 4.17 5.90 22.73 $ $ S $ $ EPS CEPS SPS 2018 2019 56.40 $ 61.50 45.10 $ 54.00 4.66 $ 5.00 6.61 $ 6.60 24.74 $ 25.65 $ $ $ $ $ Output Area: Average stock price $ 53.45 $ 49.35 $ 50.70 $ 50.75 $ 57.75 =AVERAGE(D8:09) 13.27 12.16 10.89 11.55 $ P/E ratios Average P/E EPS growth rate Average EPS 5-year growth rate Expected share price using P/E ratio 17.64 13.10 -6.06% =D18/D10 =AVERAGE(D20:H20) =E8/D8-1 1.05% -0.70% 9.04% 12.37 9.70 8.59 768 8.75 -D18/D11 P/CFPS Average P/CFPS CFPS growth rate Average CFPS 5-year growth rate Expected share price using P/CFPS 2.755 2.490 2.231 2.051 2.251 |=018/012 P/S Average P/S SPS growth rate Average sales 5-year growth rate Expected share price using P/SStep by Step Solution
There are 3 Steps involved in it
Step: 1

Get Instant Access to Expert-Tailored Solutions
See step-by-step solutions with expert insights and AI powered tools for academic success
Step: 2

Step: 3
Ace Your Homework with AI
Get the answers you need in no time with our AI-driven, step-by-step assistance
Get Started
Marketing For Financial Advisors
Authors: Eric Bradlow, Keith Niedermeier, Patti Williams
1st Edition
0071605142, 978-0071605144