Question
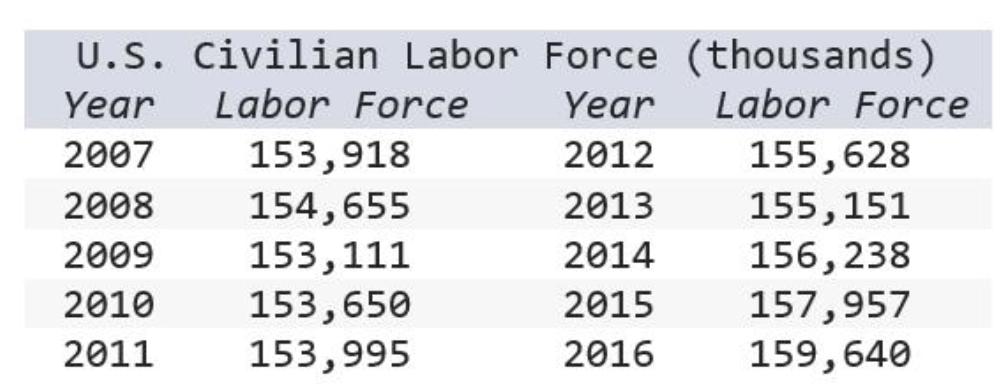
(d) Make forecasts using the following fitted trend models for years 2017-2019. (Round your answers to the nearest whole number.) Linear 158607 Exponential Quadratic


(d) Make forecasts using the following fitted trend models for years 2017-2019. (Round your answers to the nearest whole number.) Linear 158607 Exponential Quadratic 161301 11 12 159191 163354 13 159775 165652 U.S. Civilian Labor Force (thousands) Year Labor Force Year Labor Force 2007 153,918 2012 155,628 155,151 156,238 2008 154,655 153,111 153,650 153,995 2013 2009 2014 157,957 159,640 2010 2015 2011 2016
Step by Step Solution
3.49 Rating (156 Votes )
There are 3 Steps involved in it
Step: 1
Using trendlines in the Excel to obtain the equation of Linear Quadrati...
Get Instant Access to Expert-Tailored Solutions
See step-by-step solutions with expert insights and AI powered tools for academic success
Step: 2

Step: 3

Ace Your Homework with AI
Get the answers you need in no time with our AI-driven, step-by-step assistance
Get StartedRecommended Textbook for
Algebra and Trigonometry
Authors: Ron Larson
10th edition
9781337514255, 1337271179, 133751425X, 978-1337271172
Students also viewed these Finance questions
Question
Answered: 1 week ago
Question
Answered: 1 week ago
Question
Answered: 1 week ago
Question
Answered: 1 week ago
Question
Answered: 1 week ago
Question
Answered: 1 week ago
Question
Answered: 1 week ago
Question
Answered: 1 week ago
Question
Answered: 1 week ago
Question
Answered: 1 week ago
Question
Answered: 1 week ago
Question
Answered: 1 week ago
Question
Answered: 1 week ago
Question
Answered: 1 week ago
Question
Answered: 1 week ago
Question
Answered: 1 week ago
Question
Answered: 1 week ago
Question
Answered: 1 week ago
Question
Answered: 1 week ago
Question
Answered: 1 week ago
Question
Answered: 1 week ago
Question
Answered: 1 week ago
View Answer in SolutionInn App


