

Question
I am shopping for a new sedan and would like to get one with excellent miles per gallon (MPG).I heard that Japanese cars tend to
I am shopping for a new sedan and would like to get one with excellent miles per gallon (MPG).I heard that Japanese cars tend to be more fuel efficient than American cars, so I collected MPG data on a random sample of 15 Japanese sedan models (listed in the table below) to be compared to the American car statistics. The US Environmental Protection Agency reported that the average MPG for American sedans in 2022 is= 26.5 (comparison population mean). Using a significance level of ? = .05, determine whether the sample data suggests that the MPG for Japanese cars is statistically significantly greater than the MPG for American cars. Note: You will need to import this data into SPSS. Round to 3 decimal places. If the answer has only 1 or 2 decimal places you do not need to add a zero to make it 3.
A. What would be the null and alternative hypotheses (i.e., models) in both words and symbol notations for my analysis? (Hint: Consider whether a one-tailed or two-tailed test is needed.)
Null Hypothesis (H0):? ? 26.5 Alternative Hypothesis (H1):? > 26.5
The null hypothesis (H0): the mean MPG of Japanese cars is less than or equal to the mean MPG of American cars (26.5 MPG).
The alternative hypothesis (H0): the mean MPG of Japanese cars is greater than the mean MPG of American cars (26.5 MPG).
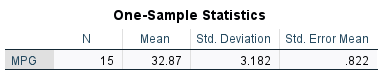
B. Calculate the sample mean for the Japanese sample. Report the answer with 3 decimal points. (Provide your calculation process.)
Sample Mean(x?) = 32.867 MPG
28+29+29+30+30+32+32+33+34+34+35+36+36+37+38/ 15 = 493 / 15 = 32.866666666667
C. Estimate the standard deviation of the Japanese car population (s or). (Report the answer with 3 decimal points. Remember to use the formula forProvide your calculation process.)
Standard Deviation (s) = 3.182
s = sqrt[SS / (n-1)]
s = sqrt[141.73333 / (15-1)] sqrt[(?(x_i - ?)^2) / (n-1)]
s = sqrt[141.73333 / 14] Variance (s^2 = 10.12381)
s = sqrt[10.12381] = 3.1817934
s = 3.182
x_i represents each score, ? is the mean, and n is the number of scores.
sqrt[((28-32.867)^2+(29-32.867)^2 +(29-32.867)^2+(30-32.867)^2 +(30-32.867)^2 +(32-32.867)^2+(32-32.867)^2+(33-32.867)^2+(34-32.867)^2+(34-32.867)^2+(35-32.867)^2+(36-32.867)^2+(36-32.867)^2+(37-32.867)^2+(38-32.867)^2 = 11.905
Sum = 23.7169 + 14.9169 + 14.9169 + 8.2769 + 8.2769 + 0.750769 + 0.750769 + 0.017769 + 1.28469 + 1.28469 + 4.61769 + 9.9169 + 9.9169 + 17.1829 + 26.4169 = (SS=141.73333)
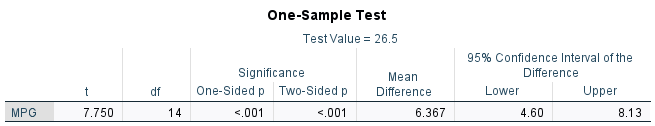
D. Calculate the t statistic using SPSS and insert a screen shot of the t-test output in SPSS - make sure to indicate what is the t-statistic. Report the answer with 3 decimal points. (Hint: In SPSS make sure to use 26.5 as the test value when running the t-test).
t = 7.750 (as indicated in the SPSS Output)
Manual verification: t-statistic = (sample mean - population mean) / (standard deviation/ sqrt(sample size)) t = (32.867 - 26.5) / (3.182 / sqrt(15)) = 7.750
E. What is the p-value based on the t-test?
p-value = The p-value is less than 0.001 (as indicated in the SPSS output).
Step by Step Solution
There are 3 Steps involved in it
Step: 1

Get Instant Access to Expert-Tailored Solutions
See step-by-step solutions with expert insights and AI powered tools for academic success
Step: 2

Step: 3
Ace Your Homework with AI
Get the answers you need in no time with our AI-driven, step-by-step assistance
Get Started
Probability With Applications and R
Authors: Robert P. Dobrow
1st edition
1118241257, 1118241258, 978-1118241257