I am struggling to complete my last question on my homework. I need some help understanding the questions and how to look at the graphs. Thanks in advance.
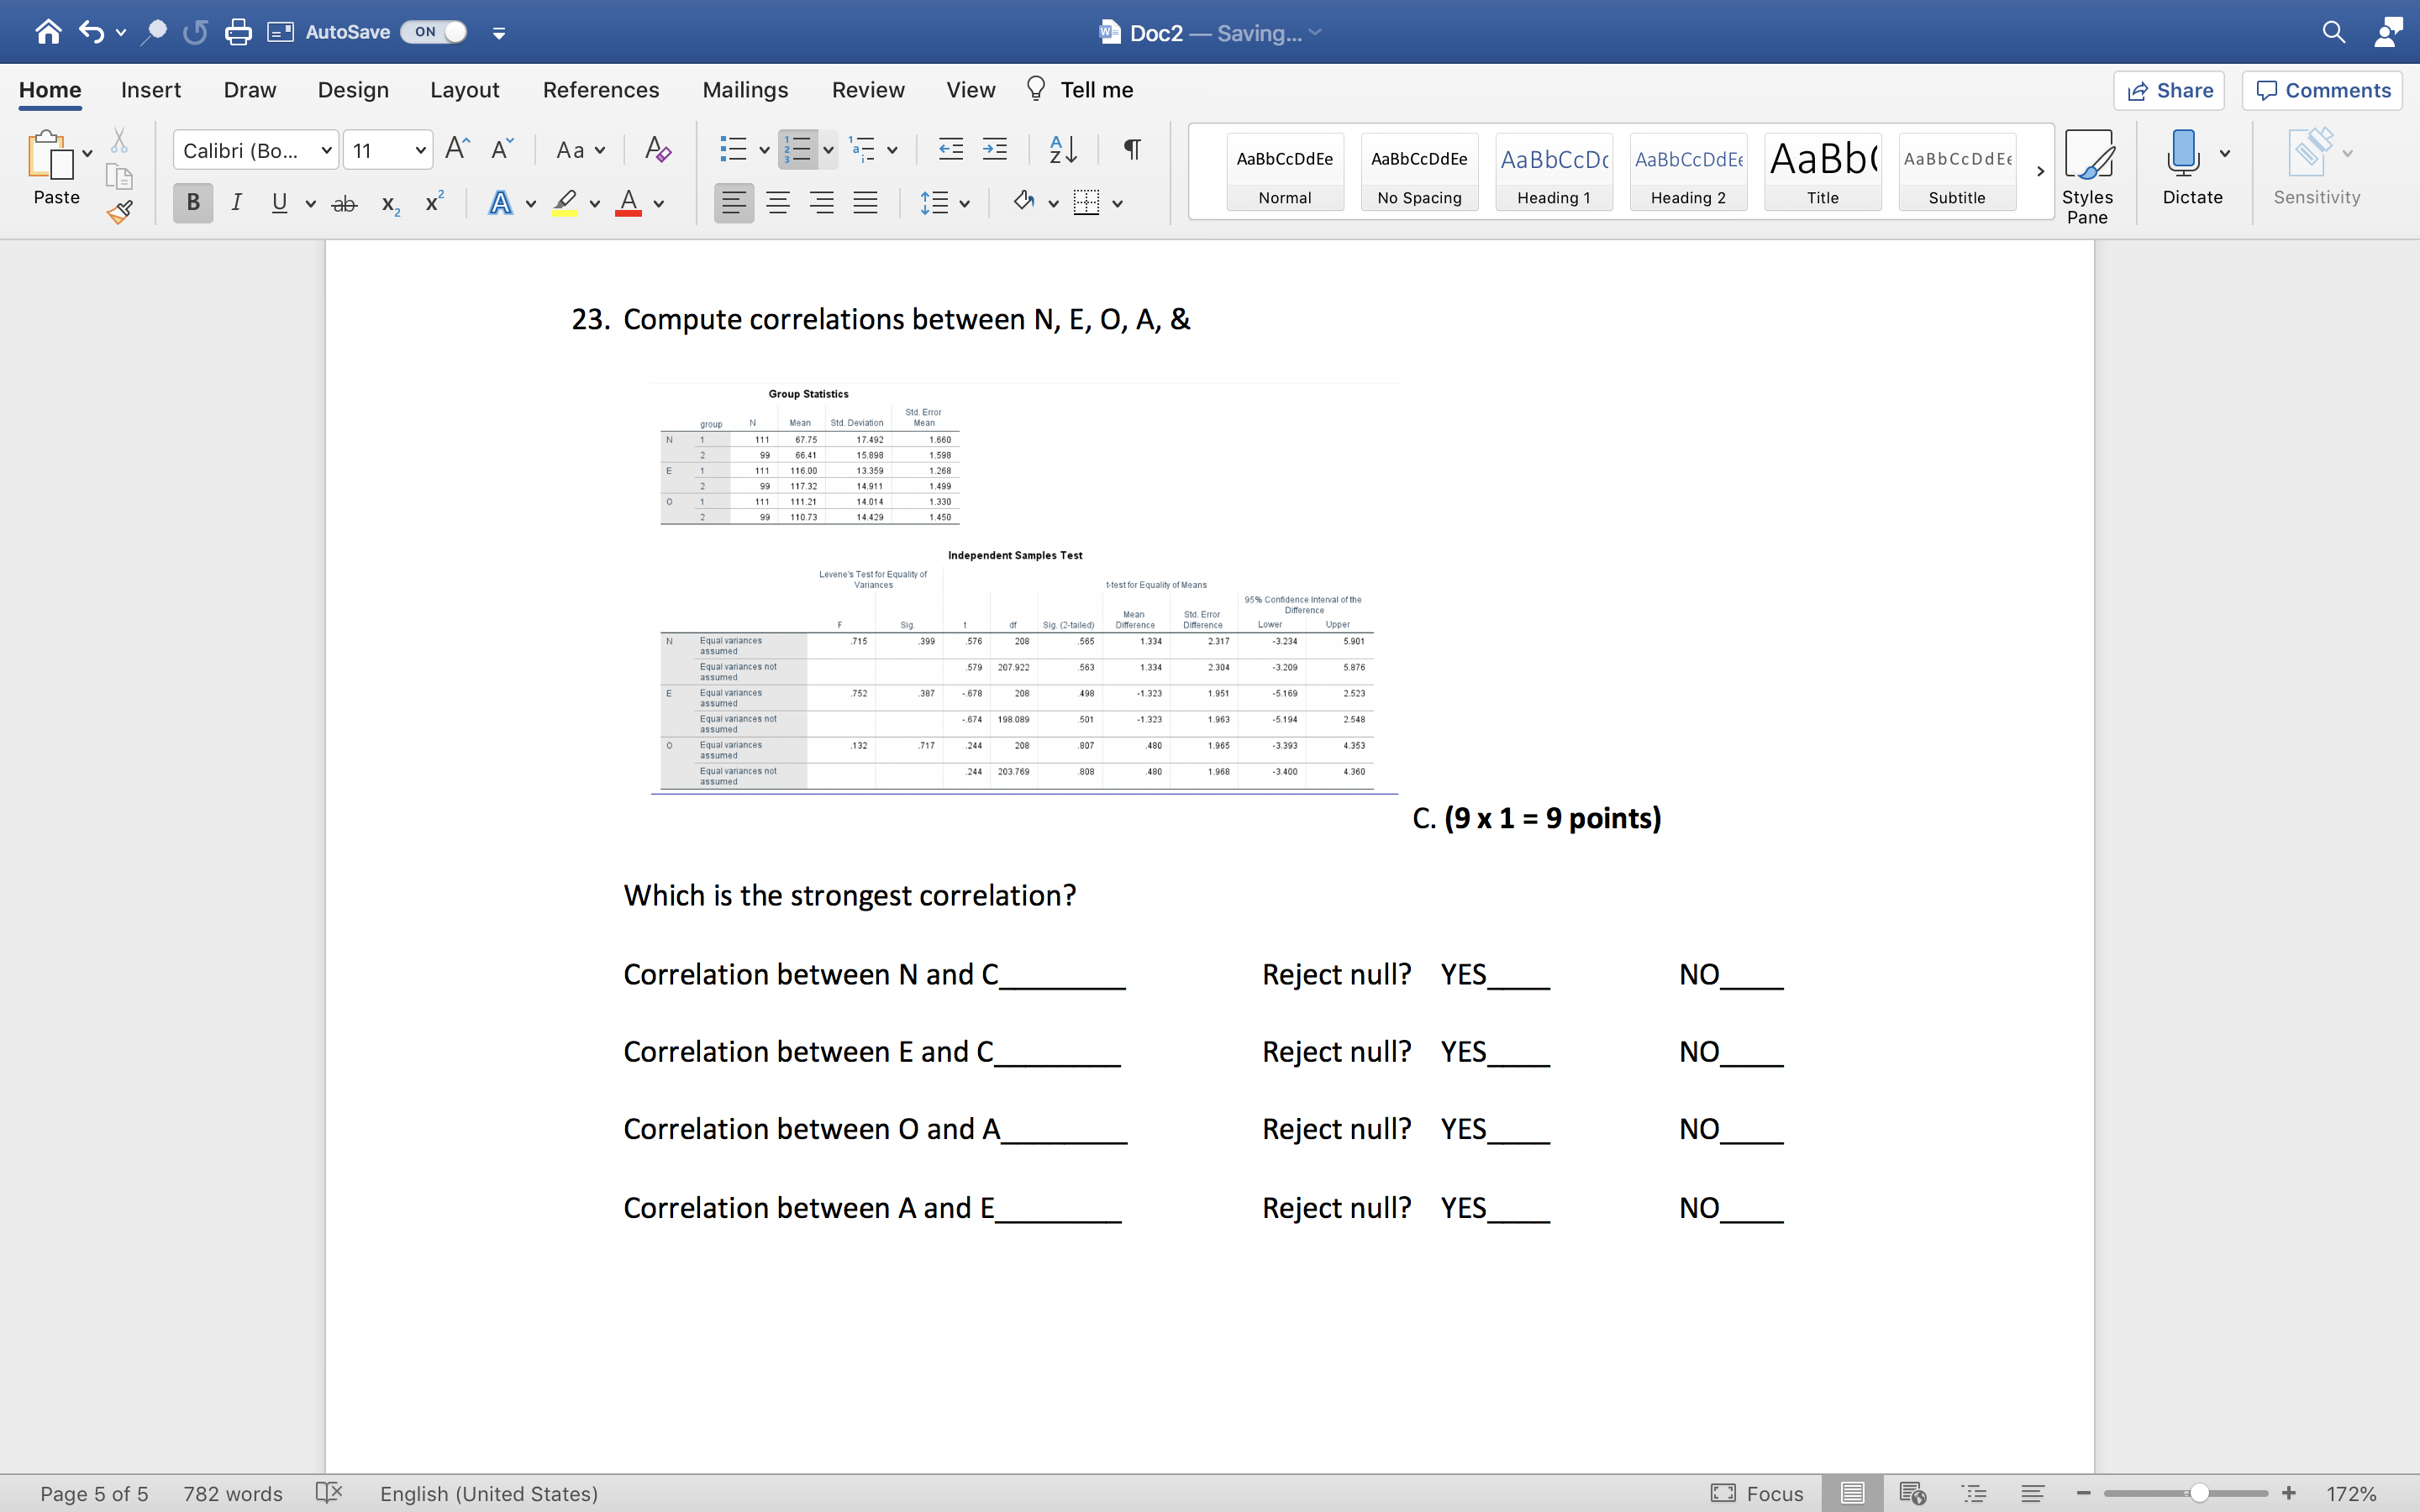
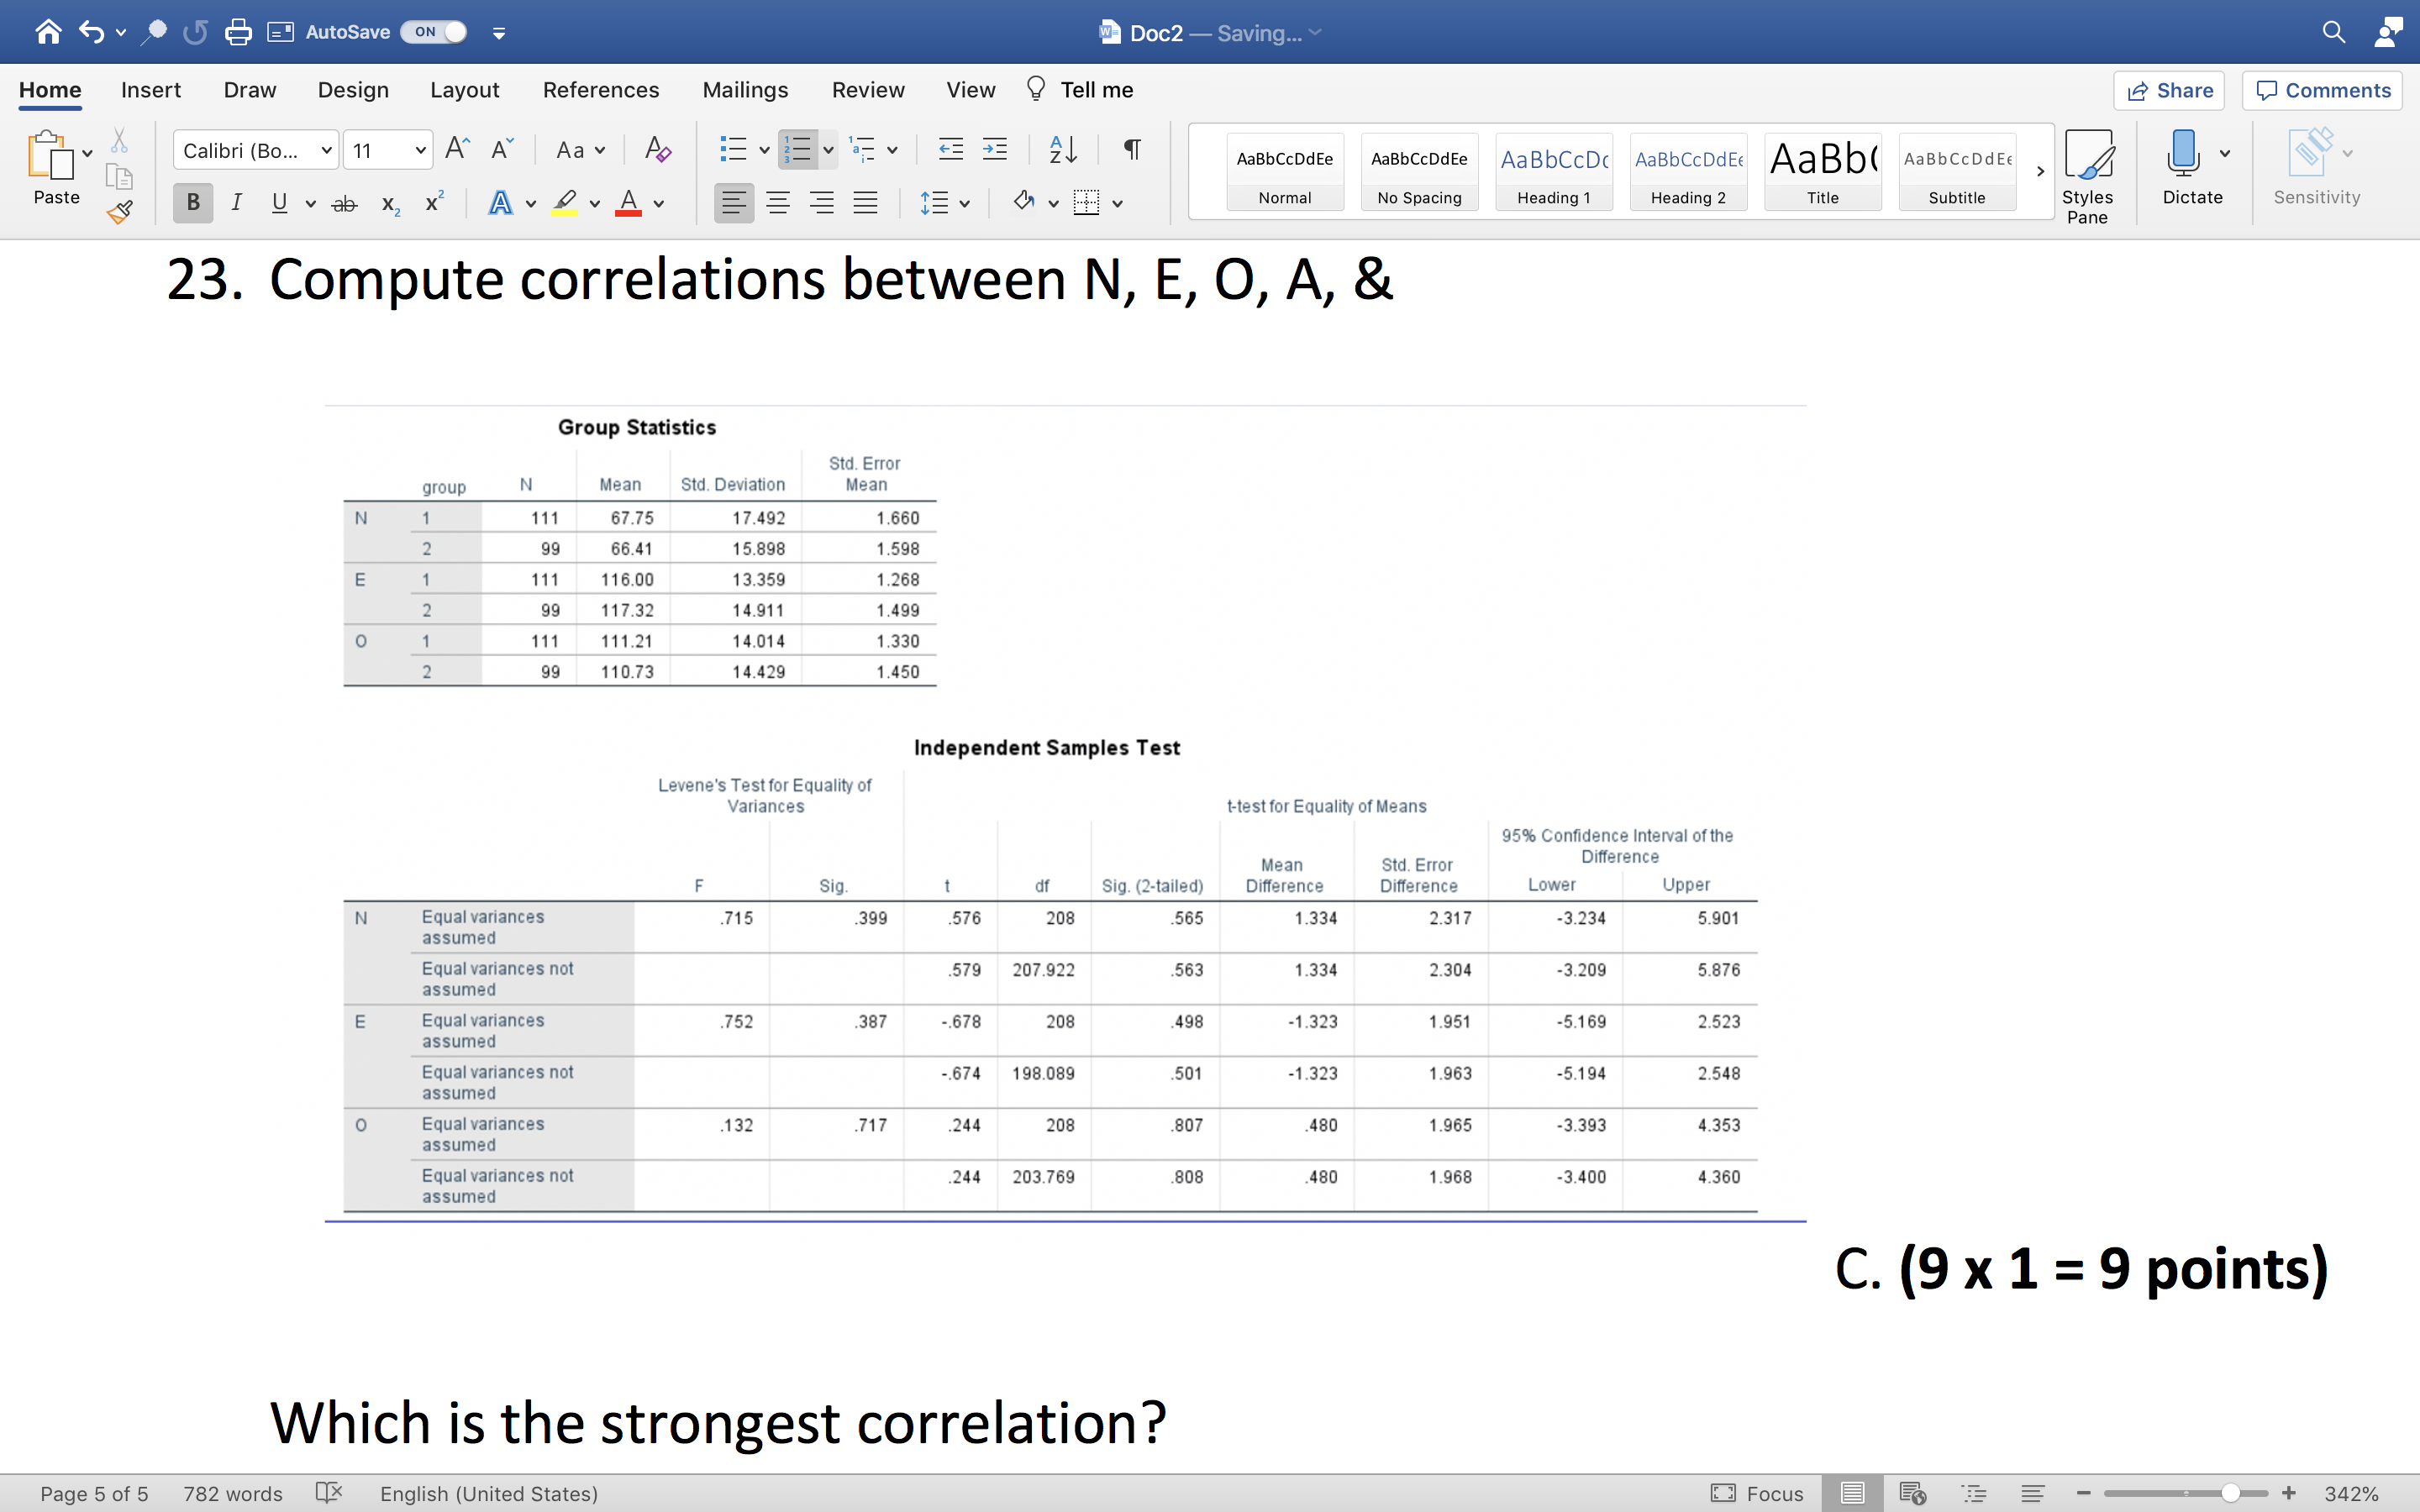
US AutoSave ON Doc2 - Saving... Home Insert Draw Design Layout References Mailings Review View ? Tell me Share Comments Calibri (Bo... v 11 A" A Aa Ap AaBbCcDdEe AaBbCcDdEe AaBbCcDc AaBbCcDdE AaBb( AaBbCCDdEF Paste BIUvab X X A DAY Norma No Spacing Heading 1 Heading 2 Title Subtitle Styles Dictate Sensitivity Pane 23. Compute correlations between N, E, O, A, & Group Statistics Sid. Error group Mean Std. Deviation 111 67.75 99 66.41 15.898 111 116.00 13.359 99 117.32 14.911 1.499 111.21 99 14.014 110.73 14.429 1 450 Independent Samples Test Levene's Test for Equality of Variances -test for Equality of Means 95% Confidence Interval of the Difference df Sig. (2-tailed) Ference Sid. Error Lower Upper N Equal variances .715 576 565 1.334 2.317 -3.234 5.901 assumed Equal variances not .579 207.922 563 1.334 2.30 3.209 5.876 Equal variances .752 387 -.678 20 498 -1.323 1.951 -5.169 2.523 assumed Equal variances not -.674 198.089 501 -1.323 1.963 -5.194 2.548 assumed Equal variances .132 .717 244 208 807 480 1.965 -3.393 4.353 assumed Equal variances not 244 203.769 1 968 3400 4 360 assumed C. (9 x 1 = 9 points) Which is the strongest correlation? Correlation between N and C_ Reject null? YES NO Correlation between E and C_ Reject null? YES NO Correlation between O and A Reject null? YES NO Correlation between A and E_ Reject null? YES NO Page 5 of 5 782 words English (United States) Focus E + 172%AVOUS AutoSave ON w Doc2 - Saving... Home Insert Draw Design Layout References Mailings Review View ? Tell me Share Comments Calibri (Bo... v 11 ~ A A Aav Ap AaBbCcDdEe AaBbCcDdEe AaBbCcDc AaBbCcDdEc AaBb( AaBbCCDdEF Paste BIUvab x X A DAY Normal No Spacing Heading 1 Heading 2 Title Subtitle Styles Dictate Sensitivity Pane 23. Compute correlations between N, E, O, A, & Group Statistics Std. Error group N Mean Std. Deviation Mean N 11 67.75 17.492 1.660 99 66.41 15.898 1.598 11 116.00 13.359 1.268 2 99 117.32 14.911 1.499 1 111 111.21 14.014 1.330 99 110.73 14.429 1.450 Independent Samples Test Levene's Test for Equality of Variances t-test for Equality of Means 95% Confidence Interval of the Mean Std. Error Difference sig. df Sig. (2-tailed) Difference Difference Lower Upper N Equal variances 715 399 576 BOC 565 1.334 2.317 3.234 5.901 assumed Equal variances not 579 207.922 .563 1.334 2.304 -3.209 5.876 assumed Equal variances 752 387 -.678 208 498 -1.323 1.951 -5.169 2.523 assumed Equal variances not -.674 198.089 501 -1.323 1.963 -5.194 2.548 assumed O Equal variances .132 717 244 208 807 480 1.965 -3.393 4.353 assumed Equal variances not 244 203.769 808 480 1.968 -3.400 4.360 assumed C. (9 x 1 = 9 points) Which is the strongest correlation? Page 5 of 5 782 words English (United States) Focus 342%