Answered step by step
Verified Expert Solution
Link Copied!

Question

1 Approved Answer

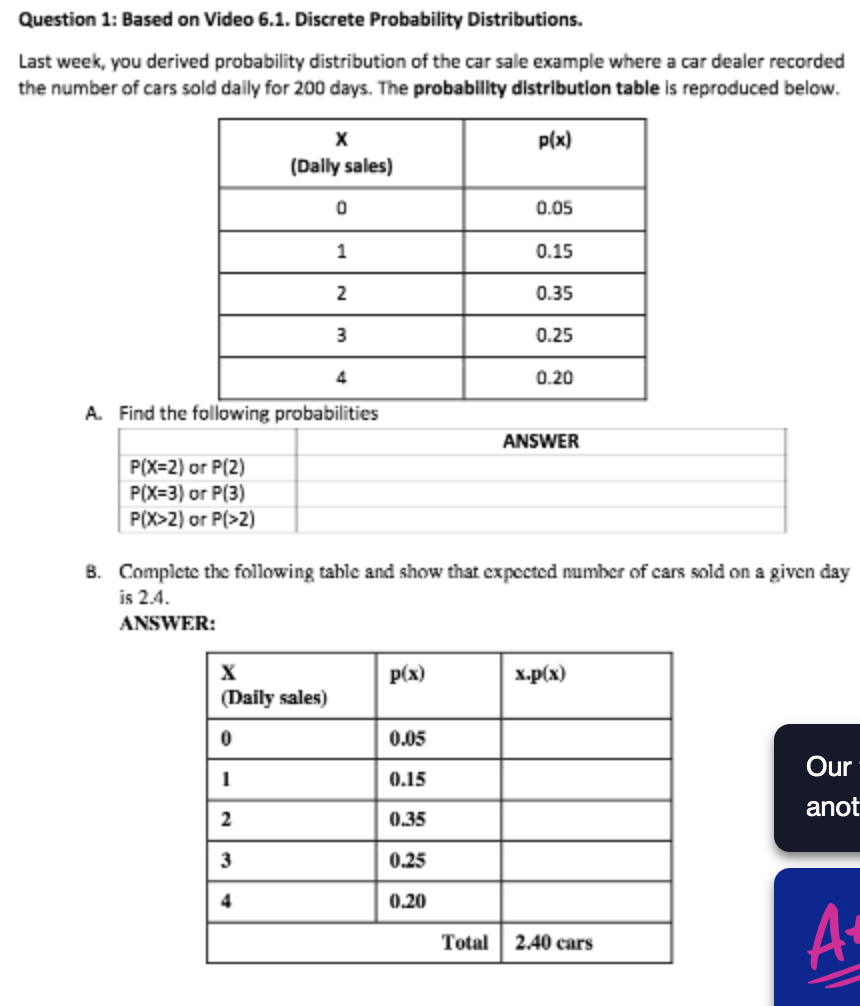
I am stuck with this Question 1: Based on Video 6.1. Discrete Probability Distributions. Last week, you derived probability distribution of the car sale example

I am stuck with this

image text in transcribedimage text in transcribedimage text in transcribedimage text in transcribed
Question 1: Based on Video 6.1. Discrete Probability Distributions. Last week, you derived probability distribution of the car sale example where a car dealer recorded the number of cars sold daily for 200 days. The probability distribution table is reproduced below. X p(x) (Dally sales) 0 0.05 0.15 N 0.35 W 0.25 0.20 A. Find the following probabilities ANSWER P(X=2) or P(2) P(X=3) or P(3) P(X>2) or P(>2) B. Complete the following table and show that expected number of cars sold on a given day is 2.4. ANSWER: X P(x) x.p(x) (Daily sales) 0 0.05 0.15 Our 2 0.35 anot 3 0.25 0.20 Total 2.40 cars AStudent ID: Workshop Time/Location: C. Complete the following table and calculate standard deviation of cars sold on a given day. ANSWER: X P(x) (x-H) =(x-240) (x-[) p(x) 0 0.05 0.15 2 0.35 0.25 4 0.20 TotalB. Consider the car sale example in question 1 above. Assume a salesman earns a fixed weekly wage of $150 plus $200 commission for each car sold. Using the laws of expected value and variance. a. Calculate expected wage of the salesman ANSWER: b. Calculate variance of the salesman's wage? ANSWER:Question 3: Based on Video 6.2. Laws of Expected Value and Variance. An investor has decided to form a portfolio by putting 25% of his money into McDonald's stock and 75% into Cisco Systems stock. The investor knows that expected returns are 8% and 15%, respectively, and that the standard deviations are 12% and 22%%, respectively. Assume: = return on stock 1 Ra = return on stock 2 = proportion of wealth invested in stock 1 W2 = proportion of wealth invested in stock 2 and = return on portfolio = = wi R: + wa Rz Using laws of expected value and variance, A. find the expected return on the portfolio. ANSWER: B. compute the standard deviation of the returns on the portfolio assuming that (@) the two stocks' returns are perfectly positively correlated (i.c. p=+1) [i) the coefficient of correlation is 0.5 (i] the two stocks' returns are negatively correlated (coefficient of correlation = 0.?). ANSWER: C. Standard deviation or variance of a portfolio represent risk. What type of portfolio are less risky?

Step by Step Solution

There are 3 Steps involved in it

Step: 1

blur-text-image

Get Instant Access to Expert-Tailored Solutions

See step-by-step solutions with expert insights and AI powered tools for academic success

Step: 2

blur-text-image

Step: 3

blur-text-image

Ace Your Homework with AI

Get the answers you need in no time with our AI-driven, step-by-step assistance

Get Started

Recommended Textbook for

Calculus Early Transcendentals

Authors: James Stewart

8th edition

1285741552, 9781305482463 , 978-1285741550

More Books

Students also viewed these Mathematics questions