

Answered step by step
Verified Expert Solution
Question
1 Approved Answer
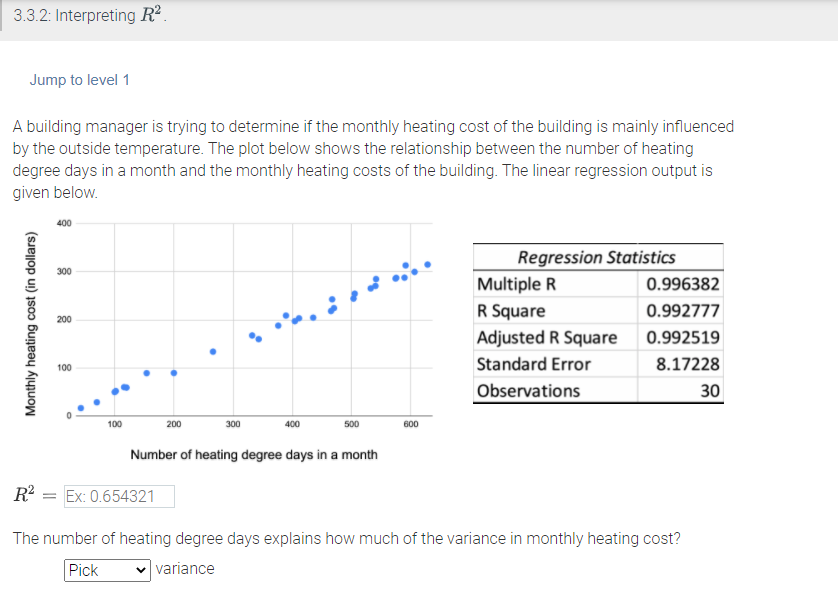
I am trying to learn how to interpret R. Is there a formula? See screenshot. Is it a standard formula? Also, is there a way
I am trying to learn how to interpret R. Is there a formula? See screenshot. Is it a standard formula? Also, is there a way to work this out in excel?
Step by Step Solution
There are 3 Steps involved in it
Step: 1

Get Instant Access to Expert-Tailored Solutions
See step-by-step solutions with expert insights and AI powered tools for academic success
Step: 2

Step: 3
Ace Your Homework with AI
Get the answers you need in no time with our AI-driven, step-by-step assistance
Get Started
Algebra Foundations Prealgebra, Algebra & Intermediate Algebra (subscription)
Authors: Elayn Martin Gay
2nd Edition
0135257506, 9780135257500