I am using a capsim program simulation and and have 3 rounds left. Should I invest 40 Million to increase automation to 10 on my 4 largest products. I will only have 2 units to benefit from it ,,It will cost about 40 Million to invest, but I will only have 2 rounds to benefit from it 7 and 8 I have the money to do it issue a decent size stock and long-term debt. I am uploading my current stats to help you advise me. Please tell me why on your answer and my highest profits are able, Acre, Aft, and Ahigh. I don't know when i should stop investing
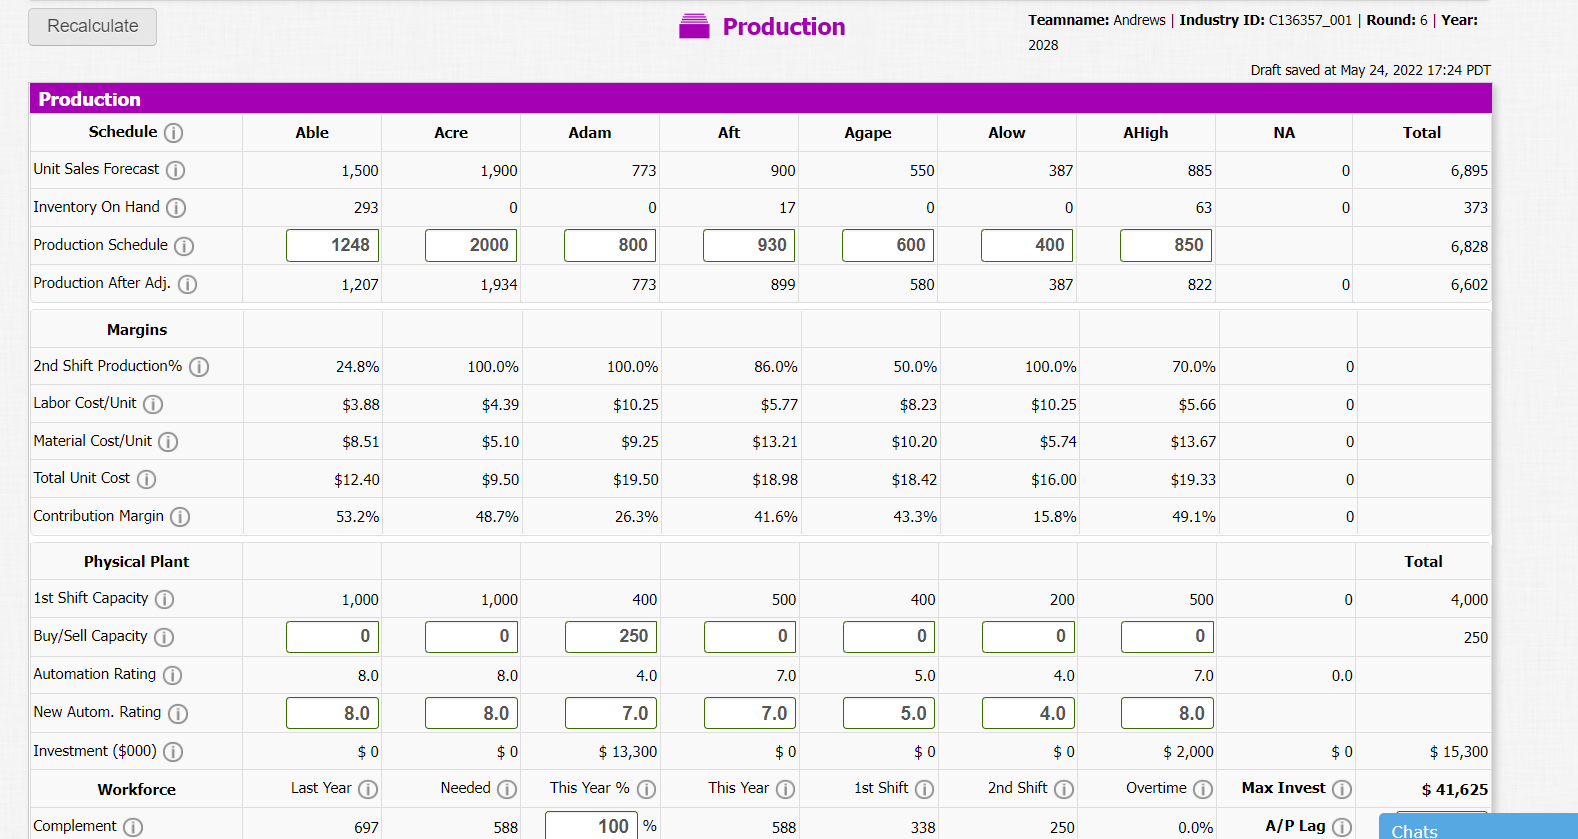
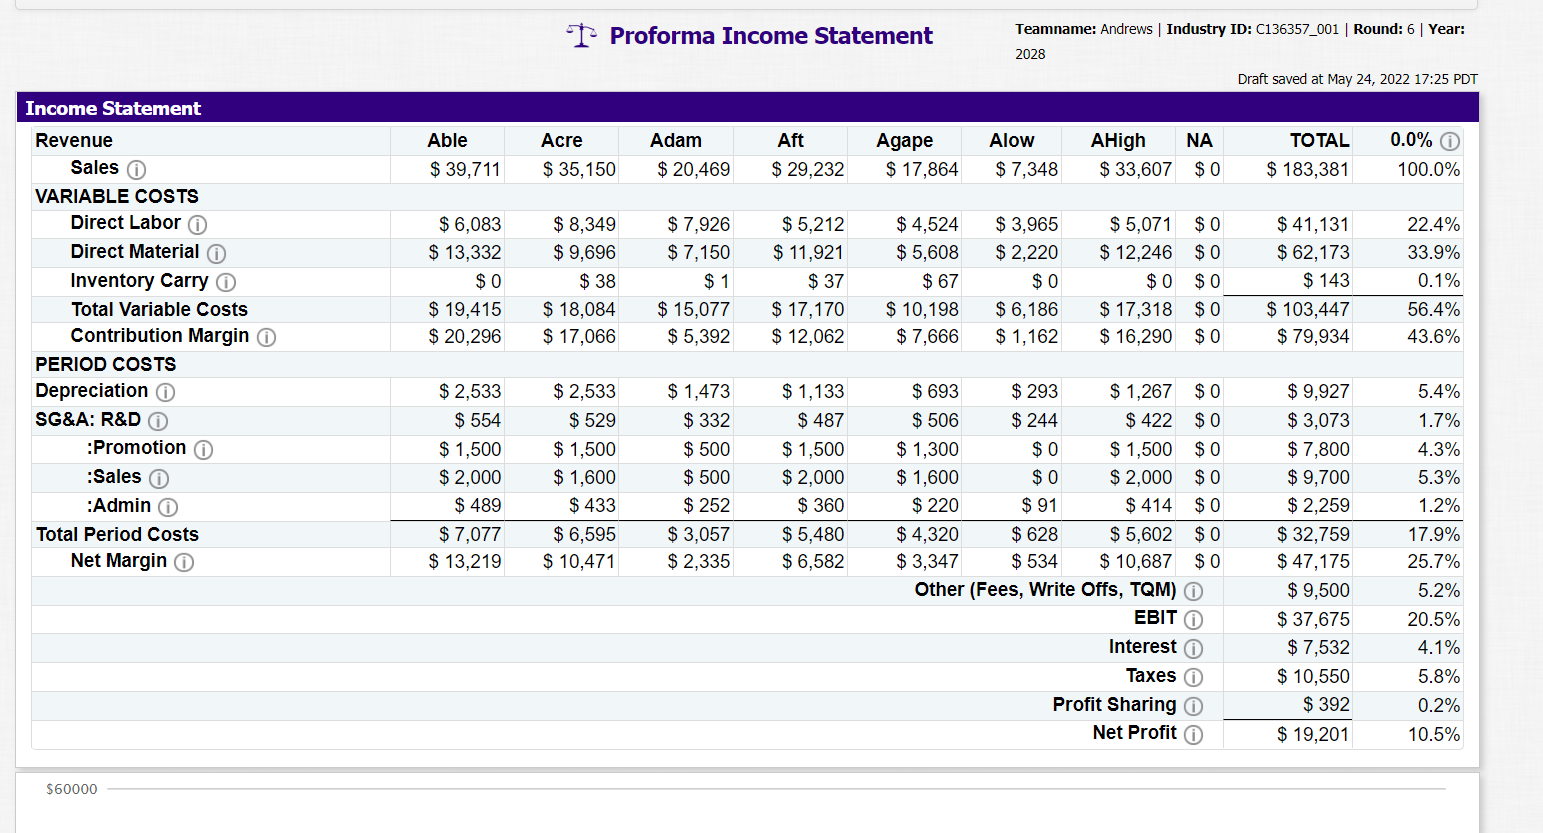
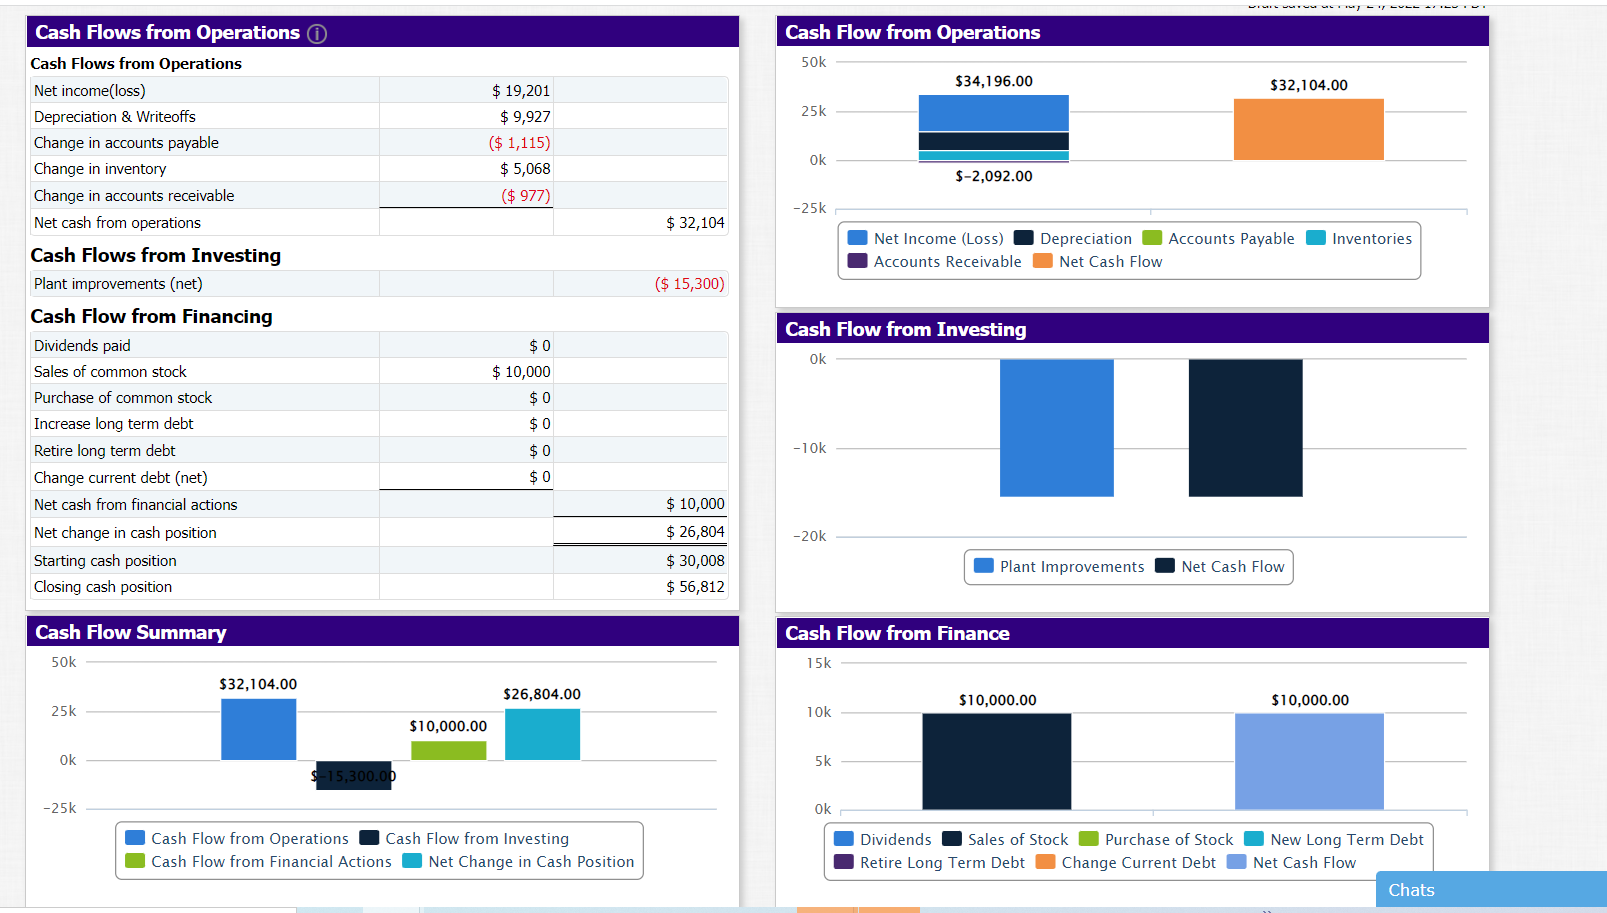
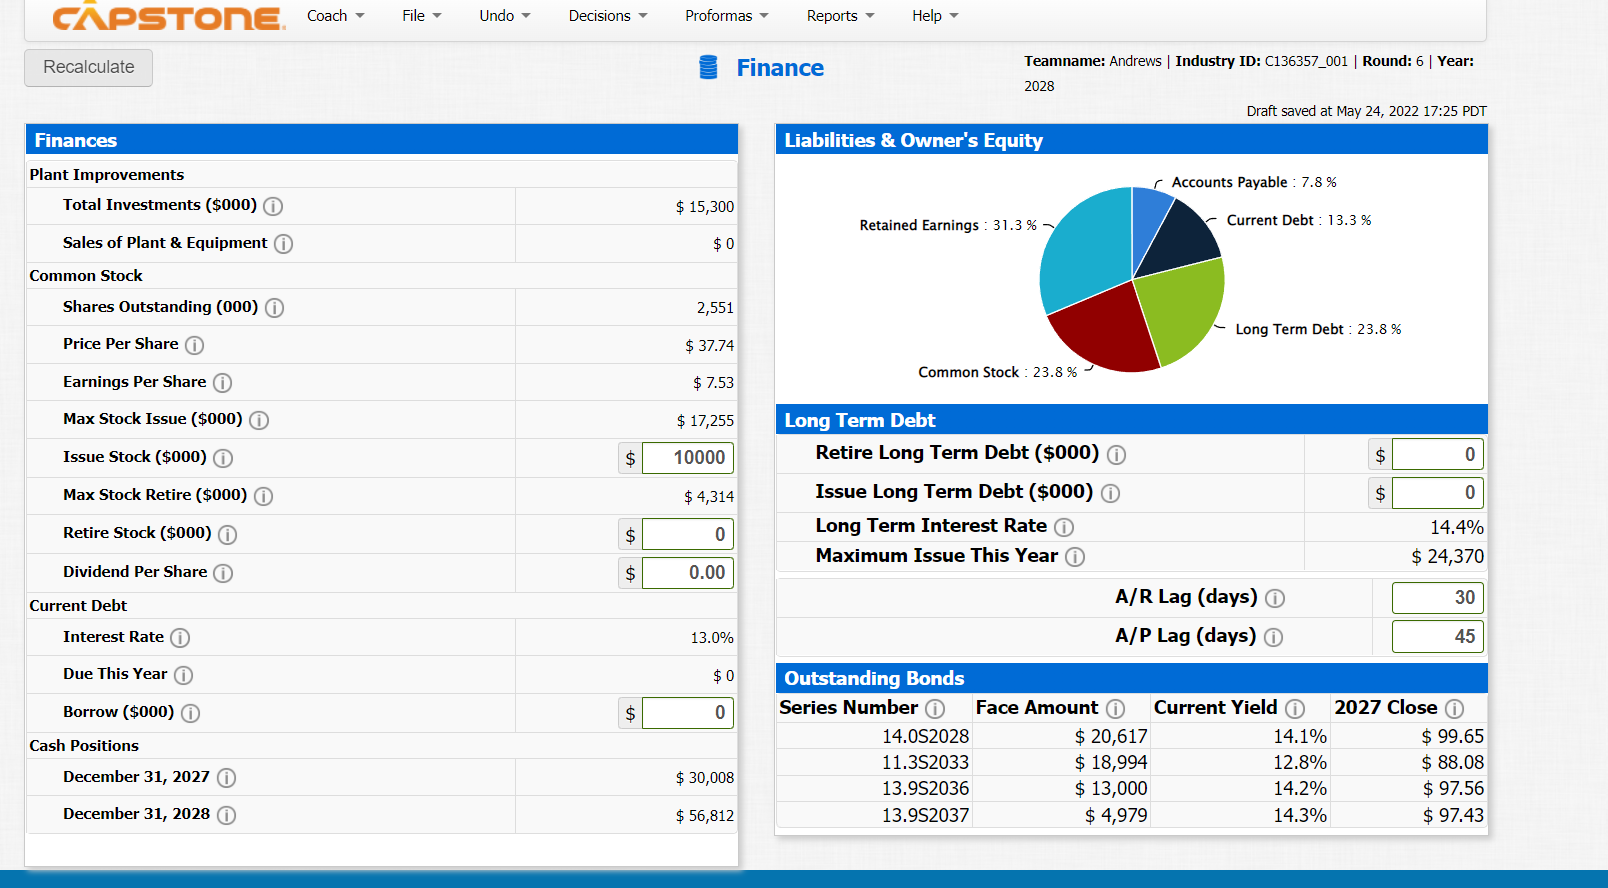
Recalculate Production Unit Sales Forecast Inventory On Hand Production Schedule Production After Adj. Margins 2nd Shift Production% Labor Cost/Unit Material Cost/Unit Total Unit Cost Contribution Margin 1st Shift Capacity i Buy/Sell Capacity Automation Rating New Autom. Rating i Investment ($000) Workforce Complement Schedule i Physical Plant Able 1,500 293 1248 1,207 24.8% $3.88 $8.51 $12.40 53.2% 1,000 0 8.0 8.0 Last Year $0 697 Acre 1,900 0 2000 1,934 100.0% $4.39 $5.10 $9.50 48.7% 1,000 0 8.0 8.0 $0 Needed i 588 Adam 773 0 800 773 100.0% $10.25 $9.25 $19.50 26.3% 400 250 4.0 7.0 $ 13,300 This Year % 100 % Production Aft 900 17 930 899 86.0% $5.77 $13.21 $18.98 41.6% 500 0 7.0 7.0 $0 This Year i 588 Agape 550 0 600 580 50.0% $8.23 $10.20 $18.42 43.3% 400 0 5.0 5.0 $0 1st Shift + 338 Teamname: Andrews | Industry ID: C136357_001 | Round: 6 | Year: 2028 Draft saved at May 24, 2022 17:24 PDT Alow AHigh Total 0 6,895 0 373 6,828 6,602 387 0 400 387 100.0% $10.25 $5.74 $16.00 15.8% 200 0 4.0 4.0 2nd Shift $0 250 885 63 850 822 70.0% $5.66 $13.67 $19.33 49.1% 500 0 7.0 8.0 $ 2,000 Overtime 0.0% Max Invest 0 0 0 0 0 0 0 0.0 $0 A/P Lagi Total 4,000 250 $ 15,300 $ 41,625 Chats Income Statement Revenue Sales VARIABLE COSTS Direct Labor Direct Material ( Inventory Carry Total Variable Costs Contribution Margin PERIOD COSTS Depreciation SG&A: R&D :Promotion ( :Sales i :Admin Total Period Costs Net Margin $60000 Able $ 39,711 $ 6,083 $ 13,332 $0 $ 19,415 $ 20,296 $ 2,533 $ 554 $1,500 $ 2,000 $ 489 $7,077 $ 13,219 Proforma Income Statement Teamname: Andrews | Industry ID: C136357_001 | Round: 6 | Year: 2028 Draft saved at May 24, 2022 17:25 PDT Aft AHigh Adam $ 20,469 Agape $ 17,864 Alow $ 7,348 TOTAL $ 183,381 0.0% 100.0% $ 29,232 $ 33,607 $0 22.4% $ 7,926 $ 7,150 $5,212 $ 11,921 $ 3,965 $ 2,220 33.9% $ 4,524 $ 5,608 $67 $ 10,198 $1 $ 37 $ 5,071 $0 $12,246 $0 $0 $0 $17,318 $0 $16,290 $0 $41,131 $ 62,173 $143 $ 103,447 $ 79,934 $0 $ 6,186 $ 1,162 $ 15,077 $ 17,170 $ 12,062 0.1% 56.4% 43.6% $ 5,392 $ 7,666 $ 1,473 $ 1,133 $ 693 $ 293 $ 244 5.4% 1.7% $ 332 $ 487 $ 506 $ 9,927 $ 3,073 $ 7,800 $ 9,700 $ 500 $ 1,500 4.3% $ 2,000 5.3% $ 500 $ 252 $1,267 $0 $422 $0 $0 $1,500 $0 $0 $2,000 $0 $ 91 $414 $0 $ 628 $0 $ 534 $ 10,687 $0 Other (Fees, Write Offs, TQM) $ 1,300 $1,600 $ 220 $4,320 $ 3,347 1.2% $360 $5,480 $6,582 $ 2,259 $ 32,759 $ 3,057 $ 5,602 17.9% 25.7% $ 2,335 $ 47,175 $9,500 5.2% 20.5% $ 37,675 EBITO Interest i Taxes 4.1% $ 7,532 $ 10,550 5.8% Profit Sharing $ 392 0.2% Net Profit $ 19,201 10.5% T Acre $ 35,150 $ 8,349 $9,696 $ 38 $ 18,084 $ 17,066 $ 2,533 $ 529 $1,500 $ 1,600 $ 433 $ 6,595 $ 10,471 Cash Flows from Operations Cash Flows from Operations Net income(loss) Depreciation & Writeoffs Change in accounts payable Change in inventory Change in accounts receivable Net cash from operations Cash Flows from Investing Plant improvements (net) Cash Flow from Financing Dividends paid Sales of common stock Purchase of common stock Increase long term debt Retire long term debt Change current debt (net) Net cash from financial actions Net change in cash position Starting cash position Closing cash position Cash Flow Summary 50k 25k Ok -25k $ 19,201 $ 9,927 ($ 1,115) $5,068 ($ 977) $0 $ 10,000 $0 $0 $0 $0 $32,104.00 $26,804.00 $10,000.00 $ 15,300.00 Cash Flow from Operations Cash Flow from Investing Cash Flow from Financial Actions Net Change in Cash Position $ 32,104 ($ 15,300) $ 10,000 $ 26,804 $ 30,008 $ 56,812 Cash Flow from Operations 50k $34,196.00 25k Ok $-2,092.00 -25k Net Income (Loss) Accounts Receivable Cash Flow from Investing Ok -10k -20k Cash Flow from Finance 15k 10k 5k Ok Depreciation Accounts Payable Net Cash Flow Net Cash Flow Plant Improvements www $32,104.00 $10,000.00 Dividends Sales of Stock Purchase of Stock Retire Long Term Debt Change Current Debt Inventories $10,000.00 New Long Term Debt Net Cash Flow Chats CAPSTONE. Coach Recalculate Finances Plant Improvements Total Investments ($000) Sales of Plant & Equipment i Shares Outstanding (000) Price Per Share Earnings Per Share Max Stock Issue ($000) Issue Stock ($000) Max Stock Retire ($000) Retire Stock ($000) ( Dividend Per Share Interest Rate (i Due This Year Borrow ($000) December 31, 2027 December 31, 2028 Common Stock Current Debt Cash Positions File Undo Decisions $ $ $ $ Proformas $ 15,300 $0 2,551 $ 37.74 $ 7.53 $ 17,255 10000 $4,314 0 0.00 13.0% $0 0 $ 30,008 $ 56,812 Help Liabilities & Owner's Equity Retained Earnings: 31.3 % Reports Finance Common Stock : 23.8 % Retire Long Term Debt ($000) Issue Long Term Debt ($000) Long Term Interest Rate ( Maximum Issue This Year Long Term Debt Teamname: Andrews | Industry ID: C136357_001 | Round: 6 | Year: 2028 Draft saved at May 24, 2022 17:25 PDT Accounts Payable: 7.8% Outstanding Bonds Series Number A/R Lag (days) A/P Lag (days) Face Amount 14.0S2028 11.3S2033 13.9S2036 13.9S2037 Current Debt: 13.3 % Long Term Debt: 23.8 % $ 20,617 $ 18,994 $ 13,000 $ 4,979 Current Yield 14.1% 12.8% 14.2% 14.3% 0 0 14.4% $ 24,370 30 45 2027 Close i $99.65 $88.08 $ 97.56 $97.43 Recalculate Production Unit Sales Forecast Inventory On Hand Production Schedule Production After Adj. Margins 2nd Shift Production% Labor Cost/Unit Material Cost/Unit Total Unit Cost Contribution Margin 1st Shift Capacity i Buy/Sell Capacity Automation Rating New Autom. Rating i Investment ($000) Workforce Complement Schedule i Physical Plant Able 1,500 293 1248 1,207 24.8% $3.88 $8.51 $12.40 53.2% 1,000 0 8.0 8.0 Last Year $0 697 Acre 1,900 0 2000 1,934 100.0% $4.39 $5.10 $9.50 48.7% 1,000 0 8.0 8.0 $0 Needed i 588 Adam 773 0 800 773 100.0% $10.25 $9.25 $19.50 26.3% 400 250 4.0 7.0 $ 13,300 This Year % 100 % Production Aft 900 17 930 899 86.0% $5.77 $13.21 $18.98 41.6% 500 0 7.0 7.0 $0 This Year i 588 Agape 550 0 600 580 50.0% $8.23 $10.20 $18.42 43.3% 400 0 5.0 5.0 $0 1st Shift + 338 Teamname: Andrews | Industry ID: C136357_001 | Round: 6 | Year: 2028 Draft saved at May 24, 2022 17:24 PDT Alow AHigh Total 0 6,895 0 373 6,828 6,602 387 0 400 387 100.0% $10.25 $5.74 $16.00 15.8% 200 0 4.0 4.0 2nd Shift $0 250 885 63 850 822 70.0% $5.66 $13.67 $19.33 49.1% 500 0 7.0 8.0 $ 2,000 Overtime 0.0% Max Invest 0 0 0 0 0 0 0 0.0 $0 A/P Lagi Total 4,000 250 $ 15,300 $ 41,625 Chats Income Statement Revenue Sales VARIABLE COSTS Direct Labor Direct Material ( Inventory Carry Total Variable Costs Contribution Margin PERIOD COSTS Depreciation SG&A: R&D :Promotion ( :Sales i :Admin Total Period Costs Net Margin $60000 Able $ 39,711 $ 6,083 $ 13,332 $0 $ 19,415 $ 20,296 $ 2,533 $ 554 $1,500 $ 2,000 $ 489 $7,077 $ 13,219 Proforma Income Statement Teamname: Andrews | Industry ID: C136357_001 | Round: 6 | Year: 2028 Draft saved at May 24, 2022 17:25 PDT Aft AHigh Adam $ 20,469 Agape $ 17,864 Alow $ 7,348 TOTAL $ 183,381 0.0% 100.0% $ 29,232 $ 33,607 $0 22.4% $ 7,926 $ 7,150 $5,212 $ 11,921 $ 3,965 $ 2,220 33.9% $ 4,524 $ 5,608 $67 $ 10,198 $1 $ 37 $ 5,071 $0 $12,246 $0 $0 $0 $17,318 $0 $16,290 $0 $41,131 $ 62,173 $143 $ 103,447 $ 79,934 $0 $ 6,186 $ 1,162 $ 15,077 $ 17,170 $ 12,062 0.1% 56.4% 43.6% $ 5,392 $ 7,666 $ 1,473 $ 1,133 $ 693 $ 293 $ 244 5.4% 1.7% $ 332 $ 487 $ 506 $ 9,927 $ 3,073 $ 7,800 $ 9,700 $ 500 $ 1,500 4.3% $ 2,000 5.3% $ 500 $ 252 $1,267 $0 $422 $0 $0 $1,500 $0 $0 $2,000 $0 $ 91 $414 $0 $ 628 $0 $ 534 $ 10,687 $0 Other (Fees, Write Offs, TQM) $ 1,300 $1,600 $ 220 $4,320 $ 3,347 1.2% $360 $5,480 $6,582 $ 2,259 $ 32,759 $ 3,057 $ 5,602 17.9% 25.7% $ 2,335 $ 47,175 $9,500 5.2% 20.5% $ 37,675 EBITO Interest i Taxes 4.1% $ 7,532 $ 10,550 5.8% Profit Sharing $ 392 0.2% Net Profit $ 19,201 10.5% T Acre $ 35,150 $ 8,349 $9,696 $ 38 $ 18,084 $ 17,066 $ 2,533 $ 529 $1,500 $ 1,600 $ 433 $ 6,595 $ 10,471 Cash Flows from Operations Cash Flows from Operations Net income(loss) Depreciation & Writeoffs Change in accounts payable Change in inventory Change in accounts receivable Net cash from operations Cash Flows from Investing Plant improvements (net) Cash Flow from Financing Dividends paid Sales of common stock Purchase of common stock Increase long term debt Retire long term debt Change current debt (net) Net cash from financial actions Net change in cash position Starting cash position Closing cash position Cash Flow Summary 50k 25k Ok -25k $ 19,201 $ 9,927 ($ 1,115) $5,068 ($ 977) $0 $ 10,000 $0 $0 $0 $0 $32,104.00 $26,804.00 $10,000.00 $ 15,300.00 Cash Flow from Operations Cash Flow from Investing Cash Flow from Financial Actions Net Change in Cash Position $ 32,104 ($ 15,300) $ 10,000 $ 26,804 $ 30,008 $ 56,812 Cash Flow from Operations 50k $34,196.00 25k Ok $-2,092.00 -25k Net Income (Loss) Accounts Receivable Cash Flow from Investing Ok -10k -20k Cash Flow from Finance 15k 10k 5k Ok Depreciation Accounts Payable Net Cash Flow Net Cash Flow Plant Improvements www $32,104.00 $10,000.00 Dividends Sales of Stock Purchase of Stock Retire Long Term Debt Change Current Debt Inventories $10,000.00 New Long Term Debt Net Cash Flow Chats CAPSTONE. Coach Recalculate Finances Plant Improvements Total Investments ($000) Sales of Plant & Equipment i Shares Outstanding (000) Price Per Share Earnings Per Share Max Stock Issue ($000) Issue Stock ($000) Max Stock Retire ($000) Retire Stock ($000) ( Dividend Per Share Interest Rate (i Due This Year Borrow ($000) December 31, 2027 December 31, 2028 Common Stock Current Debt Cash Positions File Undo Decisions $ $ $ $ Proformas $ 15,300 $0 2,551 $ 37.74 $ 7.53 $ 17,255 10000 $4,314 0 0.00 13.0% $0 0 $ 30,008 $ 56,812 Help Liabilities & Owner's Equity Retained Earnings: 31.3 % Reports Finance Common Stock : 23.8 % Retire Long Term Debt ($000) Issue Long Term Debt ($000) Long Term Interest Rate ( Maximum Issue This Year Long Term Debt Teamname: Andrews | Industry ID: C136357_001 | Round: 6 | Year: 2028 Draft saved at May 24, 2022 17:25 PDT Accounts Payable: 7.8% Outstanding Bonds Series Number A/R Lag (days) A/P Lag (days) Face Amount 14.0S2028 11.3S2033 13.9S2036 13.9S2037 Current Debt: 13.3 % Long Term Debt: 23.8 % $ 20,617 $ 18,994 $ 13,000 $ 4,979 Current Yield 14.1% 12.8% 14.2% 14.3% 0 0 14.4% $ 24,370 30 45 2027 Close i $99.65 $88.08 $ 97.56 $97.43