I asked this question before and the answers were incorrect. I have attached the entire question along with the data from the excel to work
I asked this question before and the answers were incorrect. I have attached the entire question along with the data from the excel to work these problems.
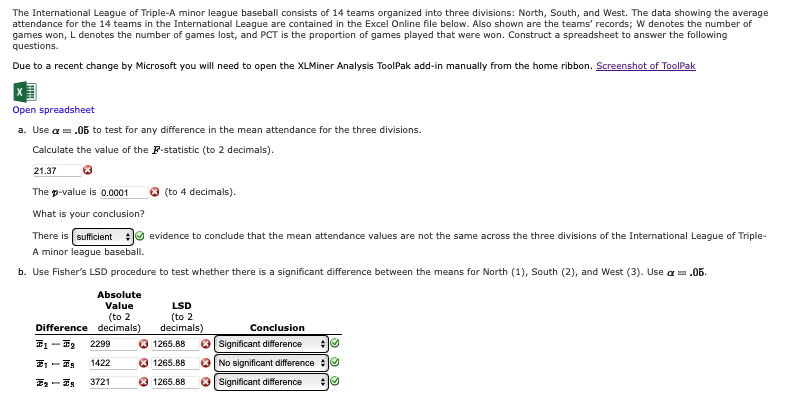
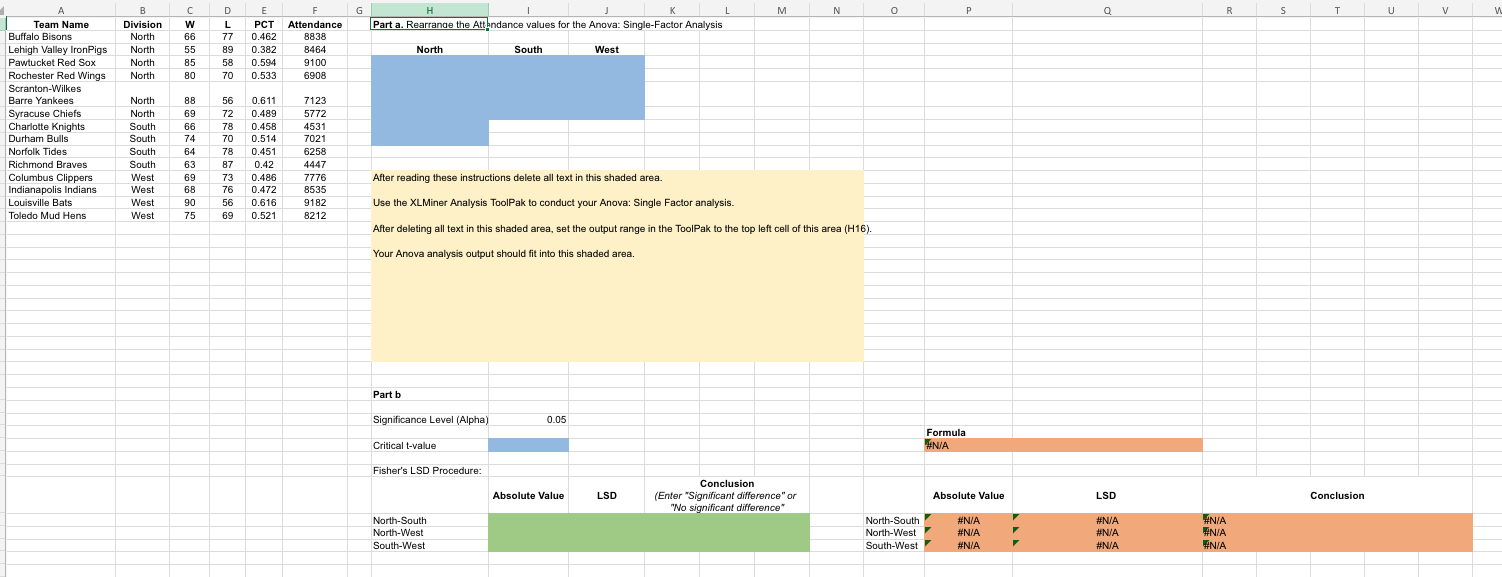
The International League of Triple-A minor league baseball consists of 14 teams organized into three divisions: North, South, and West. The data showing the average attendance for the 14 teams in the International League are contained in the Excel Online file below. Also shown are the teams' records; W denotes the number of games won, L denotes the number of games lost, and PCT is the proportion of games played that were won. Construct a spreadsheet to answer the following questions. Due to a recent change by Microsoft you will need to open the XLMiner Analysis ToolPak add-in manually from the home ribbon. Screenshot of ToolPak X Open spreadsheet a. Use a = .06 to test for any difference in the mean attendance for the three divisions. Calculate the value of the F-statistic (to 2 decimals). 21.37 The p-value is 0.0001 (to 4 decimals). What is your conclusion? There is | sufficient *@ evidence to conclude that the mean attendance values are not the same across the three divisions of the International League of Triple- A minor league baseball. b. Use Fisher's LSD procedure to test whether there is a significant difference between the means for North (1), South (2), and West (3). Use a = .06. Absolute Value LSD (to 2 (to 2 Difference decimals) decimals) Conclusion 2299 1265.88 Significant difference 1422 X 1265.88 No significant difference # 3721 1265.88 Significant differenceC D E G H K M N 0 P Q R S T U Team Name Division W L PCT Attendance Part a. Rearrange the Attendance values for the Anova: Single-Factor Analysis Buffalo Bisons North 77 0.462 8838 Lehigh Valley IronPigs North 65 89 0.382 346 North South West Pawtucket Red Sox North 35 58 0.594 9100 Rochester Red Wings North 70 0.533 6908 Scranton-Wilkes Barre Yankees North 56 0.611 7123 Syracuse Chiefs North 69 72 0.489 5772 Charlotte Knights South 66 78 0.458 4531 Durham Bulls South 74 70 0.514 7021 Norfolk Tides South 64 78 0.451 6258 Richmond Braves South 63 87 0.42 4447 Columbus Clippers West 69 73 0.486 7776 After reading these instructions delete all text in this shaded area. Indianapolis Indians West 68 76 0.472 8535 Louisville Bats West 90 56 0.616 9182 Use the XLMiner Analysis ToolPak to conduct your Anova: Single Factor analysis. Toledo Mud Hens West 75 69 0.521 8212 After deleting all text in this shaded area, set the output range in the ToolPak to the top left cell of this area (H16). Your Anova analysis output should fit into this shaded area. Part b Significance Level (Alpha) 0.05 Formula Critical t-value #N/A Fisher's LSD Procedure: Conclusion Absolute Value LSD (Enter "Significant difference" or Absolute Value LSD Conclusion "No significant difference* North-South North-South #N/A #NIA ENIA North-West North-West #NIA #NIA ENIA South-West South-West #N/A #N/A INIA
Step by Step Solution
There are 3 Steps involved in it
Step: 1
Get Instant Access to Expert-Tailored Solutions
See step-by-step solutions with expert insights and AI powered tools for academic success
Step: 2
Step: 3
Ace Your Homework with AI
Get the answers you need in no time with our AI-driven, step-by-step assistance