I asked this question previously and was unable to find a solution. Can I please get help with this? All information (entire questions & data
I asked this question previously and was unable to find a solution. Can I please get help with this? All information (entire questions & data from excel) are included below.
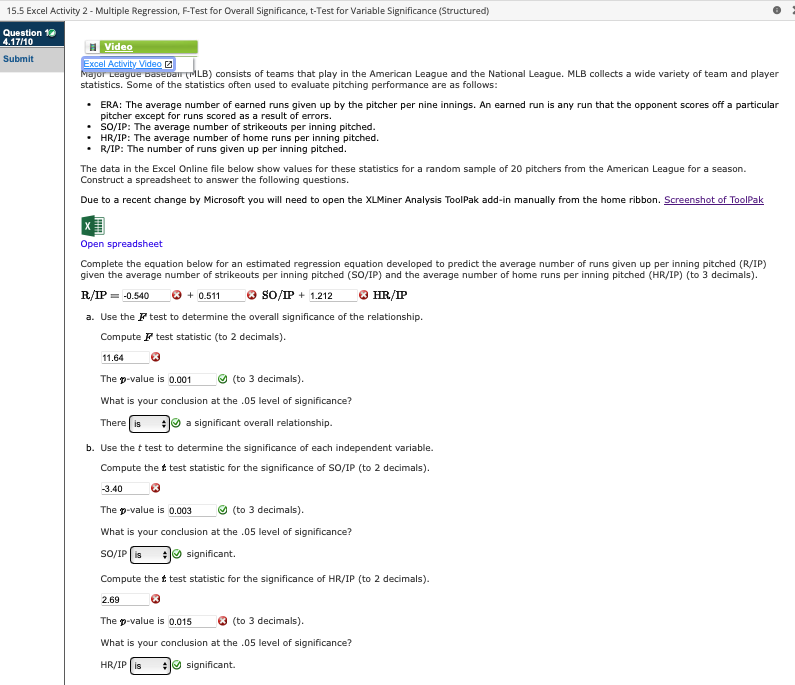
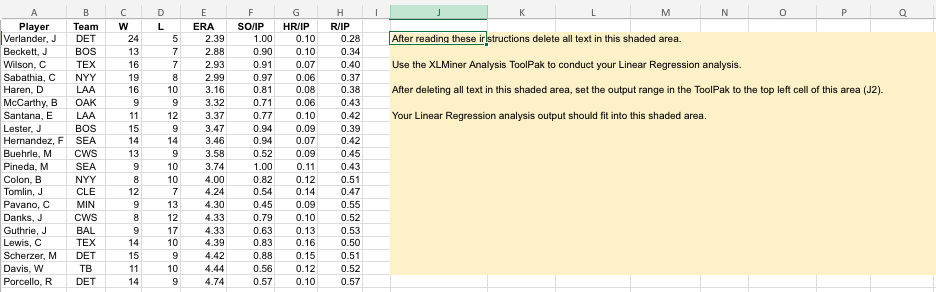
15.5 Excel Activity 2 - Multiple Regression, F-Test for Owerall Significance, t-Test for Variable Significance (Structurad) [T L CN ] Submit e = LB} consists of teams that play in the American League and the Natienal League. MLE collects a wide variety of team and player statistics. Some af the statistics often used to evaluate pitching performance are as follows: = ERA: The average number of earned runs given up by the pitcher per nine innings. An earnaed run is any run that the opponent scores off a particular pitcher except for runs scored as a result of errors. = S0/IP: The average number of strikeouts per inning pitched. = HR/IP: The average number of heme runs per inning pitched. = R/IP: The number of runs given up per inning pitched. The data in the Excel Online file below show values for these statistics for a random sample of 20 pitchers from the American League for a season. Caonstruct a spreadshest to answer the following questions. Due to a recent change by Microsoft you will need to open the XLMiner Analysis ToolPak add-in manually from the home ribbon. Screenshot of ToolPak Open spreadsheat Complete the equation below for an estimated regression equation developed to predict the average number of runs given up per inning pitched (R/IF) given the average number of strikeouts per inning pitched (SO/IP) and the average number of home runs per inning pitched (HR/IF) (to 3 dedmals). R/IP = -0.840 & + 0511 @ 80/TP + 1.212 & HR,/TP a. Use the I test to determine the overall significance of the relationship. Compute F test statistic (to 2 decimals). 11.64 @ The p-value is 0.001 @ (to 3 decimals). What is your conclusion at the .05 level of significance? There @ a significant overall relationship. b. Use the f test to determine the significance of each independent variable. Compute the test statistic for the significance of SO/IP (to 2 decimals). 340 Q The p-value is 0.003 @ (to 3 decimals). What is your conclusion at the .05 level of significance? SO/IP @ significant. Compute the test statistic for the significance of HR/IP (to 2 decimals). 268 Q The p-value is 0.015 @ (to 3 decimals). What is your conclusion at the .05 level of significance? HRYIP @ significant. B C D E F G H K M N P Player Team W L ERA SOAP HR/IP R/IP Verlander, J DET 24 5 2.39 1.00 0.10 0.28 After reading these irlstructions delete all text in this shaded area. Beckett, J BOS 13 7 2.88 0.90 0.10 0.34 Wilson, C TEX 16 7 2.93 0.91 0.07 0.40 Use the XLMiner Analysis ToolPak to conduct your Linear Regression analysis. Sabathia, C NYY 19 8 2.99 0.97 0.06 0.37 Haren, D LAA 16 10 3.16 0.81 0.08 0.38 After deleting all text in this shaded area, set the output range in the ToolPak to the top left cell of this area (J2). Mccarthy, B OAK 9 9 3.32 0.71 0.06 0.43 Santana, E LAA 11 12 3.37 0.77 0.10 0.42 Your Linear Regression analysis output should fit into this shaded area. Lester, J BOS 15 9 3.47 0.94 0.09 0.39 Hernandez, F SEA 14 14 3.46 0.94 0.07 0.42 Buehrle, M CWS 13 9 3.58 0.52 0.09 0.45 Pineda, M SEA 9 10 3.74 1.00 0.11 0.43 Colon, B NYY 8 10 4.00 0.82 0.12 0.51 Tomlin, J CLE 12 7 4.24 0.54 0.14 0.47 Pavano, C MIN 9 13 4.30 0.45 0.09 0.55 Danks, J CWS 12 4.33 0.79 0.10 0.52 Guthrie, J BAL 9 17 4.33 0.63 0.13 0.53 Lewis, C TEX 14 10 4.39 0.83 0.16 0.50 Scherzer, M DET 15 9 4.42 0.88 0.15 0.51 Davis, W TB 11 10 4.44 0.56 0.12 0.52 Porcello, R DET 14 9 4.74 0.57 0.10 0.57
Step by Step Solution
There are 3 Steps involved in it
Step: 1
Get Instant Access to Expert-Tailored Solutions
See step-by-step solutions with expert insights and AI powered tools for academic success
Step: 2
Step: 3
Ace Your Homework with AI
Get the answers you need in no time with our AI-driven, step-by-step assistance