

Question
I attach to this file a data set on 19 rats. The data set includes four variables: Body Weight (in grams), Liver Weight (in grams),
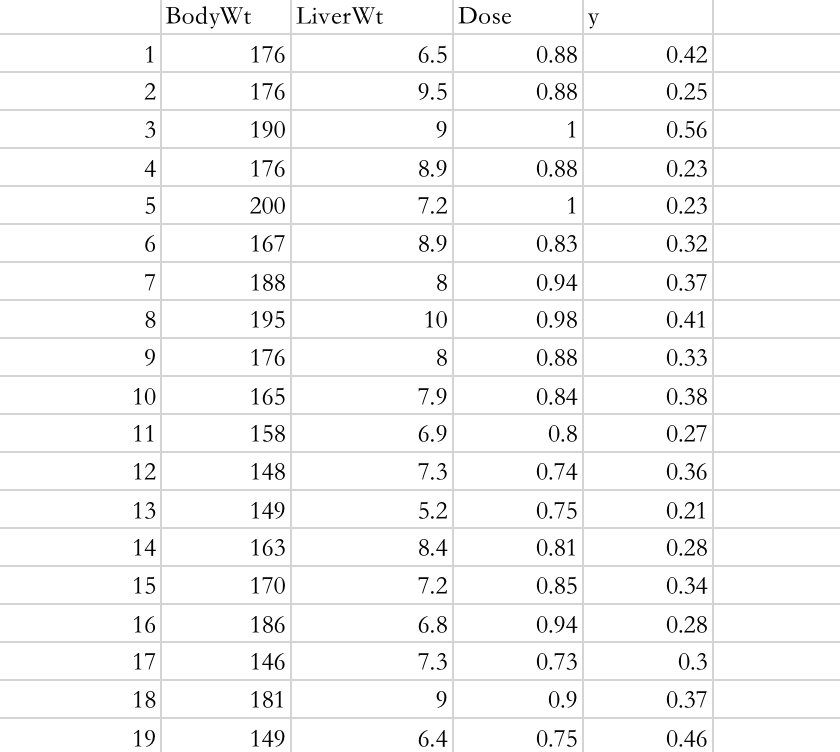
I attach to this file a data set on 19 rats. The data set includes four variables: Body Weight (in grams), Liver Weight (in grams), and two other variables you can ignore for this question. I want you to make a scatter plot (using Excel or R) for predicting Liver Weight from Body Weight and add the least squares regression line. Please label the axes appropriately.
Step by Step Solution
There are 3 Steps involved in it
Step: 1

Get Instant Access to Expert-Tailored Solutions
See step-by-step solutions with expert insights and AI powered tools for academic success
Step: 2

Step: 3
Ace Your Homework with AI
Get the answers you need in no time with our AI-driven, step-by-step assistance
Get Started
College Algebra (Subscription)
Authors: Mark Dugopolski
6th Edition
0321916670, 9780321916679