 I believe I did # 1 done I need help with 2- 4 in regards to the unknown portion TIA!
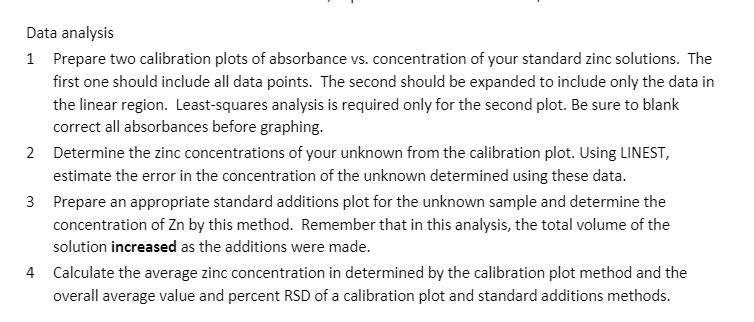
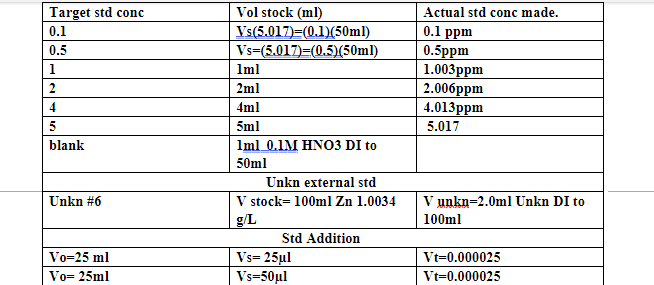
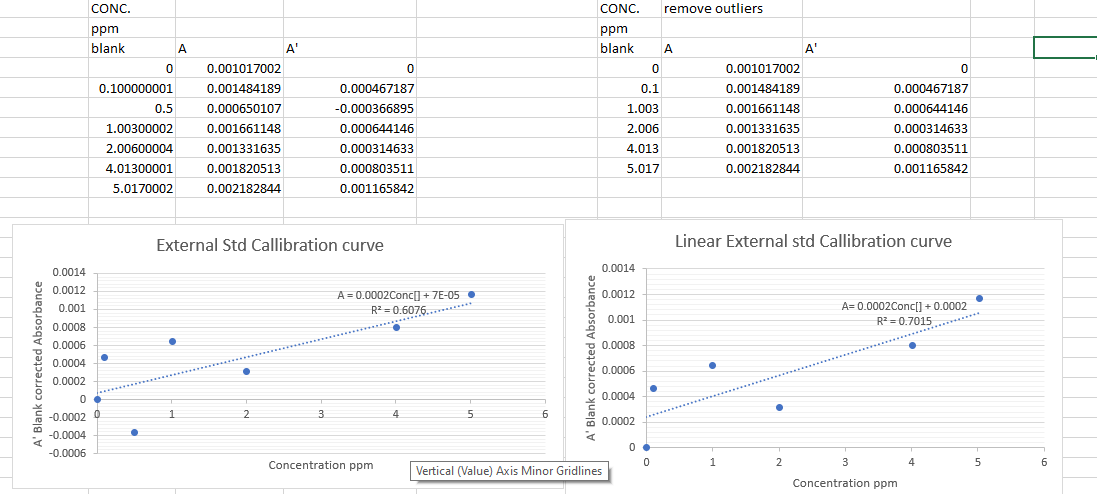
Data analysis 1 Prepare two calibration plots of absorbance vs. concentration of your standard zinc solutions. The first one should include all data points. The second should be expanded to include only the data in the linear region. Least-squares analysis is required only for the second plot. Be sure to blank correct all absorbances before graphing. 2 Determine the zinc concentrations of your unknown from the calibration plot. Using LINEST, estimate the error in the concentration of the unknown determined using these data. 3 Prepare an appropriate standard additions plot for the unknown sample and determine the concentration of Zn by this method. Remember that in this analysis, the total volume of the solution increased as the additions were made. 4 Calculate the average zinc concentration in determined by the calibration plot method and the overall average value and percent RSD of a calibration plot and standard additions methods. Actual std conc made. 0.1 ppm Target std conc 0.1 0.5 1 2 4 5 blank 0.5ppm 1.003ppm 2.006ppm 4.013ppm 5.017 Vol stock (ml) Vs(5.017)=(0.1/50ml) Vs=(5,017)=(0.5) (50ml) Iml 2ml 4ml 5ml Iml .IM HNO3 DI to 50ml Unkn external std V stock=100ml Zn 1.0034 g/L Std Addition Vs=25ul Vs=50ul Unkn #6 V unkn=2.0ml Unkn DI to 100ml Vo=25 ml Vo= 25ml Vt=0.000025 Vt=0.000025 A 0 CONC. ppm blank A 0 0.100000001 0.5 1.00300002 2.00600004 4.01300001 5.0170002 0.001017002 0.001484189 0.000650107 0.001661148 0.001331635 0.001820513 0.002182844 0.000467187 -0.000366895 0.000644146 0.000314633 0.000803511 0.001165842 CONC. remove outliers ppm blank A A' 0 0.001017002 0.1 0.001484189 1.003 0.001661148 2.006 0.001331635 4.013 0.001820513 5.017 0.002182844 0 0.000467187 0.000644146 0.000314633 0.000803511 0.001165842 External Std Callibration curve Linear External std Callibration curve 0.0014 A= 0.0002 Conc[] +7E-05 0.0012 R2=0.6076..**** 0.001 0.0014 0.0012 0.001 0.0008 0.0006 0.0004 0.0002 A=0.0002Conc[] + 0.0002 RP=0.7015...****** 0.0008 A' Blank corrected Absorbance A' Blank corrected Absorbance 0.0006 0.0004 0 -0.0002 2 3 4 5 6 0.0002 -0.0004 -0.0006 0. 0 Concentration ppm 1 2 3 5 6 Vertical (Value) Axis Minor Gridlines Concentration ppm Data analysis 1 Prepare two calibration plots of absorbance vs. concentration of your standard zinc solutions. The first one should include all data points. The second should be expanded to include only the data in the linear region. Least-squares analysis is required only for the second plot. Be sure to blank correct all absorbances before graphing. 2 Determine the zinc concentrations of your unknown from the calibration plot. Using LINEST, estimate the error in the concentration of the unknown determined using these data. 3 Prepare an appropriate standard additions plot for the unknown sample and determine the concentration of Zn by this method. Remember that in this analysis, the total volume of the solution increased as the additions were made. 4 Calculate the average zinc concentration in determined by the calibration plot method and the overall average value and percent RSD of a calibration plot and standard additions methods. Actual std conc made. 0.1 ppm Target std conc 0.1 0.5 1 2 4 5 blank 0.5ppm 1.003ppm 2.006ppm 4.013ppm 5.017 Vol stock (ml) Vs(5.017)=(0.1/50ml) Vs=(5,017)=(0.5) (50ml) Iml 2ml 4ml 5ml Iml .IM HNO3 DI to 50ml Unkn external std V stock=100ml Zn 1.0034 g/L Std Addition Vs=25ul Vs=50ul Unkn #6 V unkn=2.0ml Unkn DI to 100ml Vo=25 ml Vo= 25ml Vt=0.000025 Vt=0.000025 A 0 CONC. ppm blank A 0 0.100000001 0.5 1.00300002 2.00600004 4.01300001 5.0170002 0.001017002 0.001484189 0.000650107 0.001661148 0.001331635 0.001820513 0.002182844 0.000467187 -0.000366895 0.000644146 0.000314633 0.000803511 0.001165842 CONC. remove outliers ppm blank A A' 0 0.001017002 0.1 0.001484189 1.003 0.001661148 2.006 0.001331635 4.013 0.001820513 5.017 0.002182844 0 0.000467187 0.000644146 0.000314633 0.000803511 0.001165842 External Std Callibration curve Linear External std Callibration curve 0.0014 A= 0.0002 Conc[] +7E-05 0.0012 R2=0.6076..**** 0.001 0.0014 0.0012 0.001 0.0008 0.0006 0.0004 0.0002 A=0.0002Conc[] + 0.0002 RP=0.7015...****** 0.0008 A' Blank corrected Absorbance A' Blank corrected Absorbance 0.0006 0.0004 0 -0.0002 2 3 4 5 6 0.0002 -0.0004 -0.0006 0. 0 Concentration ppm 1 2 3 5 6 Vertical (Value) Axis Minor Gridlines Concentration ppm