I cant figure out #10.
Thank you
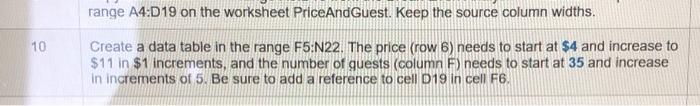
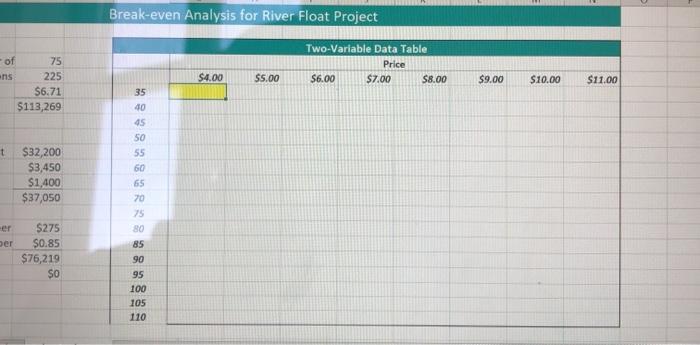
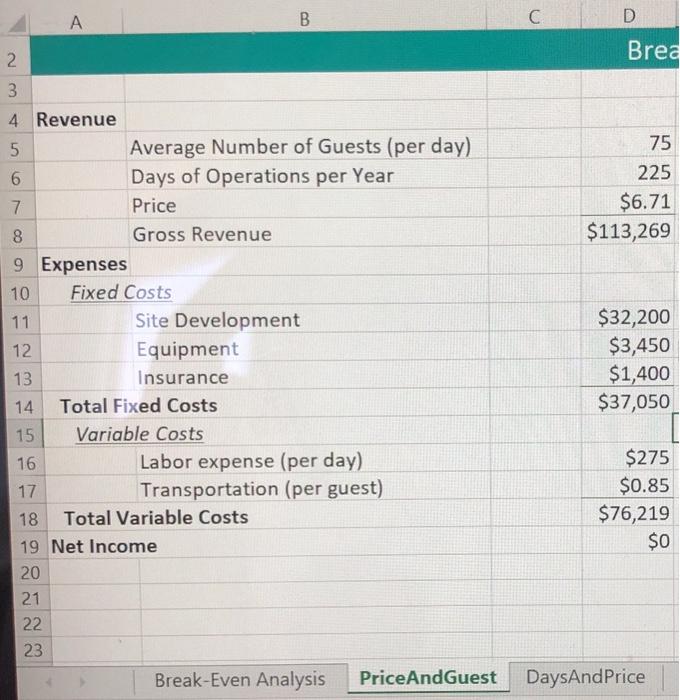
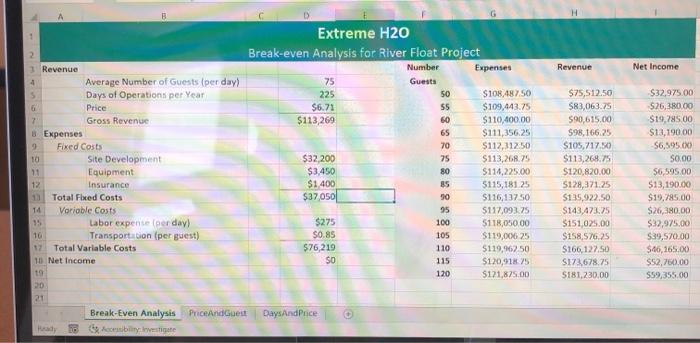
range A4:D19 on the worksheet PriceAndGuest. Keep the source column widths. 10 Create a data table in the range F5:N22. The price (row 6) needs to start at $4 and increase to $11 in $1 increments, and the number of guests (column F) needs to start at 35 and increase in increments of 5. Be sure to add a reference to cell 019 in cell F6. Break-even Analysis for River Float Project Two-Variable Data Table Price $6.00 $7.00 $8.00 $4.00 $5.00 $9.00 - of 75 ns 225 $6.71 $113,269 $10.00 $11.00 t $32,200 $3,450 $1,400 $37,050 35 40 45 50 55 60 65 70 75 80 85 90 95 100 ber $275 $0.85 $76,219 $0 105 110 A B C D Brea 2 75 225 $6.71 $113,269 3 4 Revenue 5 Average Number of Guests (per day) 6 Days of Operations per Year 7. Price 8 Gross Revenue 9 Expenses 10 Fixed Costs 11 Site Development 12 Equipment Insurance 14 Total Fixed Costs 15 Variable Costs 16 Labor expense (per day) 17 Transportation (per guest) 18 Total Variable Costs 19 Net Income 20 21 22 23 Break-Even Analysis PriceAndGuest $32,200 $3,450 $1,400 $37,050 13 $275 $0.85 $76,219 $0 DaysAndPrice Revenue Net Income Extreme H20 2 Break-even Analysis for River Float Project 3 Revenue Number Expenses Average Number of Guests (per day) 75 Guests Days of Operations per Year 225 50 $108,48750 6 Price $6.71 55 $109.443.75 Gross Revenue $113,269 60 $110,400.00 8 Expenses 65 $111,356.25 Fixed Costs 70 $112,31250 10 Site Development $32 200 75 $113,268.75 Equipment $3,450 80 $114,225.00 12 Insurance $1,400 85 $115,181 25 Total Fixed Costs $37050 30 $116,13750 14 Vorioble Costs 95 $117,093.75 Labor expente per day) $275 100 5118,050.00 10 Transportation (per guest) $0.85 105 $119,00625 Total Variable Costs $76,219 110 $119,962.50 10 Net Income SO 115 $120,91875 19 120 $121,875.00 20 21 Break-Even Analysis PriceAndGuest DaysAnd Price 16 Ability investigate $75,512.50 SR3,063.75 590,615.00 598,166.25 $105,717.50 $113,268.75 $120,820.00 5128,371.25 $135,922.50 $143.473.25 $151,025.00 $158,576.25 $166,127.50 S173678.75 S181,230,00 $32,975.00 $26,380.00 $19,785 00 $13,190.00 S6,595.00 S0.00 $6,595.00 $13,190.00 $19,785.00 $26,380,00 $32,975.00 $39,570.00 $46,165.00 $52,760.00 559,355.00 range A4:D19 on the worksheet PriceAndGuest. Keep the source column widths. 10 Create a data table in the range F5:N22. The price (row 6) needs to start at $4 and increase to $11 in $1 increments, and the number of guests (column F) needs to start at 35 and increase in increments of 5. Be sure to add a reference to cell 019 in cell F6. Break-even Analysis for River Float Project Two-Variable Data Table Price $6.00 $7.00 $8.00 $4.00 $5.00 $9.00 - of 75 ns 225 $6.71 $113,269 $10.00 $11.00 t $32,200 $3,450 $1,400 $37,050 35 40 45 50 55 60 65 70 75 80 85 90 95 100 ber $275 $0.85 $76,219 $0 105 110 A B C D Brea 2 75 225 $6.71 $113,269 3 4 Revenue 5 Average Number of Guests (per day) 6 Days of Operations per Year 7. Price 8 Gross Revenue 9 Expenses 10 Fixed Costs 11 Site Development 12 Equipment Insurance 14 Total Fixed Costs 15 Variable Costs 16 Labor expense (per day) 17 Transportation (per guest) 18 Total Variable Costs 19 Net Income 20 21 22 23 Break-Even Analysis PriceAndGuest $32,200 $3,450 $1,400 $37,050 13 $275 $0.85 $76,219 $0 DaysAndPrice Revenue Net Income Extreme H20 2 Break-even Analysis for River Float Project 3 Revenue Number Expenses Average Number of Guests (per day) 75 Guests Days of Operations per Year 225 50 $108,48750 6 Price $6.71 55 $109.443.75 Gross Revenue $113,269 60 $110,400.00 8 Expenses 65 $111,356.25 Fixed Costs 70 $112,31250 10 Site Development $32 200 75 $113,268.75 Equipment $3,450 80 $114,225.00 12 Insurance $1,400 85 $115,181 25 Total Fixed Costs $37050 30 $116,13750 14 Vorioble Costs 95 $117,093.75 Labor expente per day) $275 100 5118,050.00 10 Transportation (per guest) $0.85 105 $119,00625 Total Variable Costs $76,219 110 $119,962.50 10 Net Income SO 115 $120,91875 19 120 $121,875.00 20 21 Break-Even Analysis PriceAndGuest DaysAnd Price 16 Ability investigate $75,512.50 SR3,063.75 590,615.00 598,166.25 $105,717.50 $113,268.75 $120,820.00 5128,371.25 $135,922.50 $143.473.25 $151,025.00 $158,576.25 $166,127.50 S173678.75 S181,230,00 $32,975.00 $26,380.00 $19,785 00 $13,190.00 S6,595.00 S0.00 $6,595.00 $13,190.00 $19,785.00 $26,380,00 $32,975.00 $39,570.00 $46,165.00 $52,760.00 559,355.00