i can't find the probability of the answer.
Should i use standard error instead of s.d. of difference to find the answer?
Variables
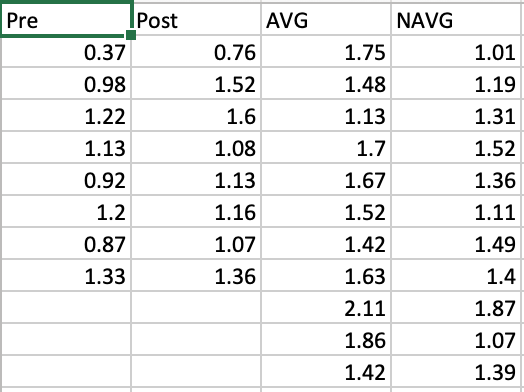
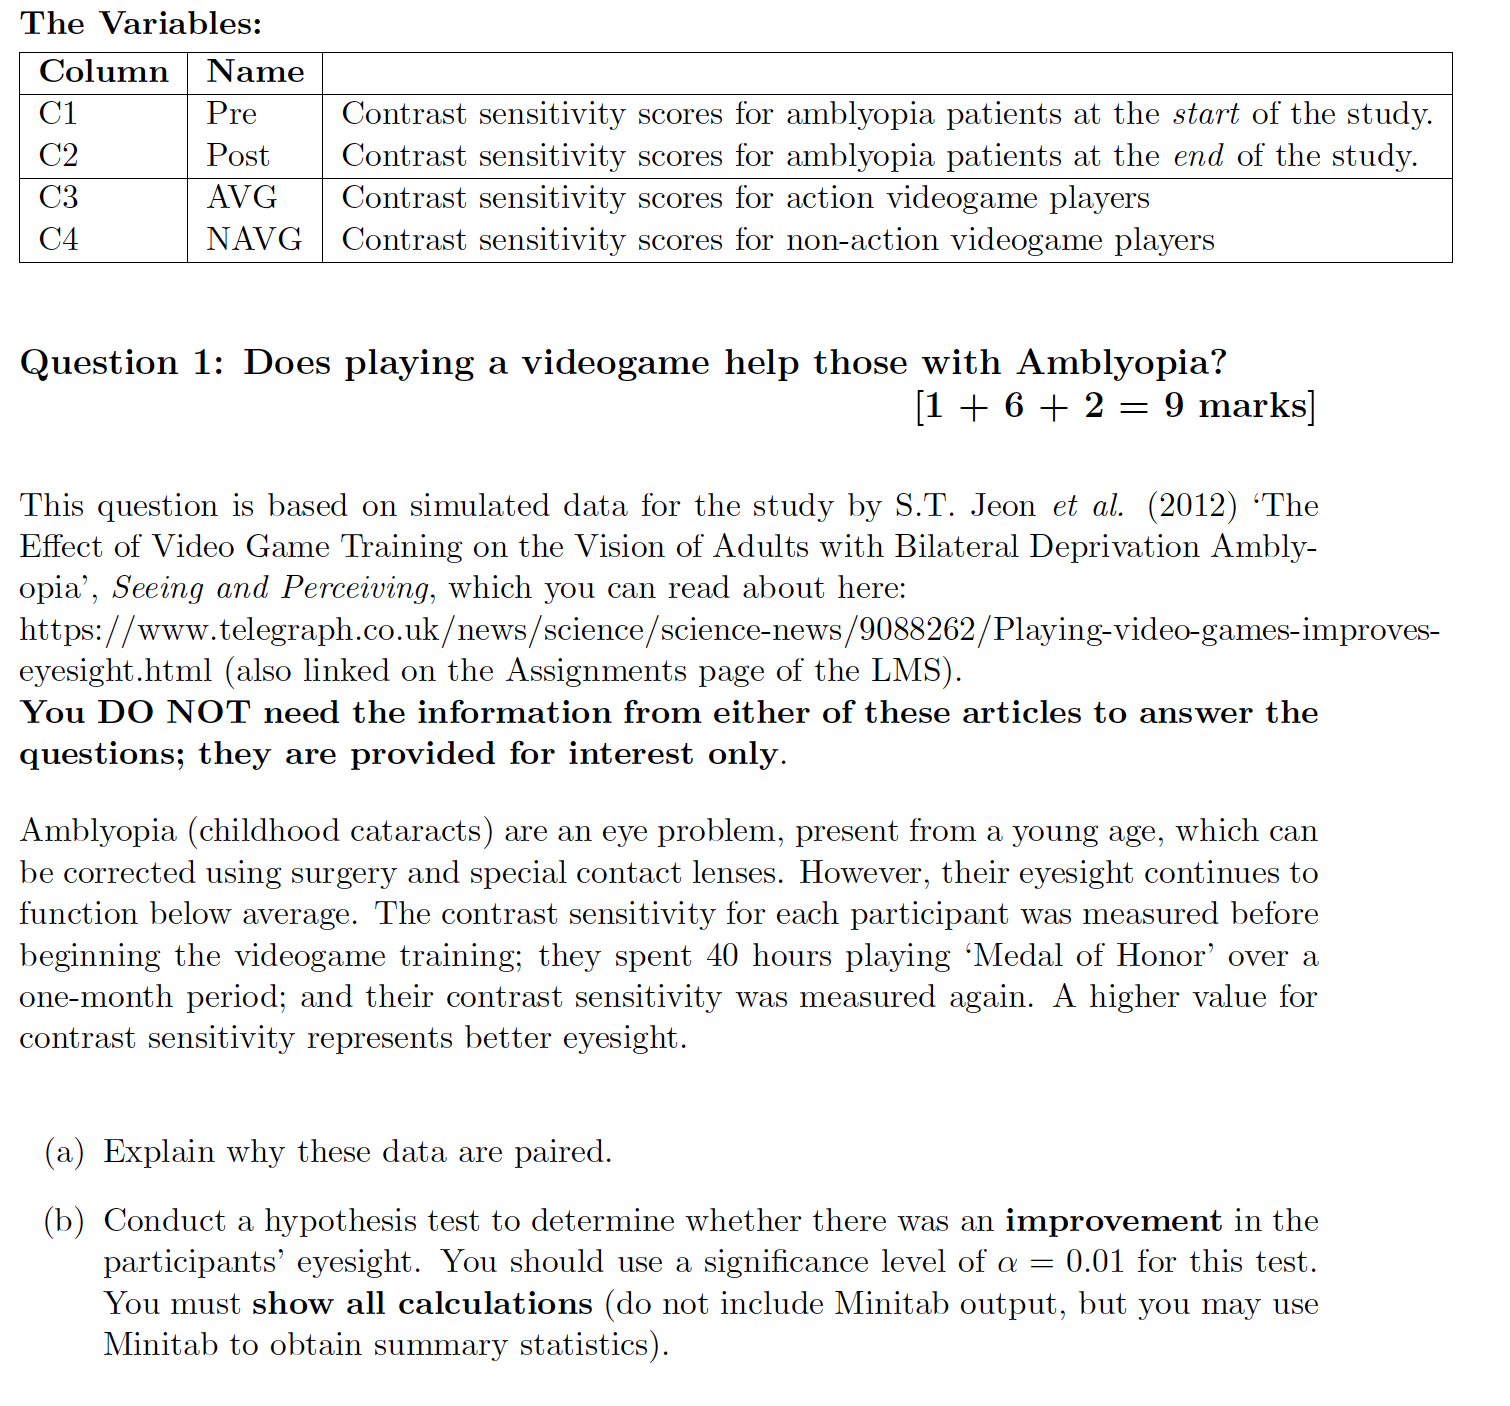
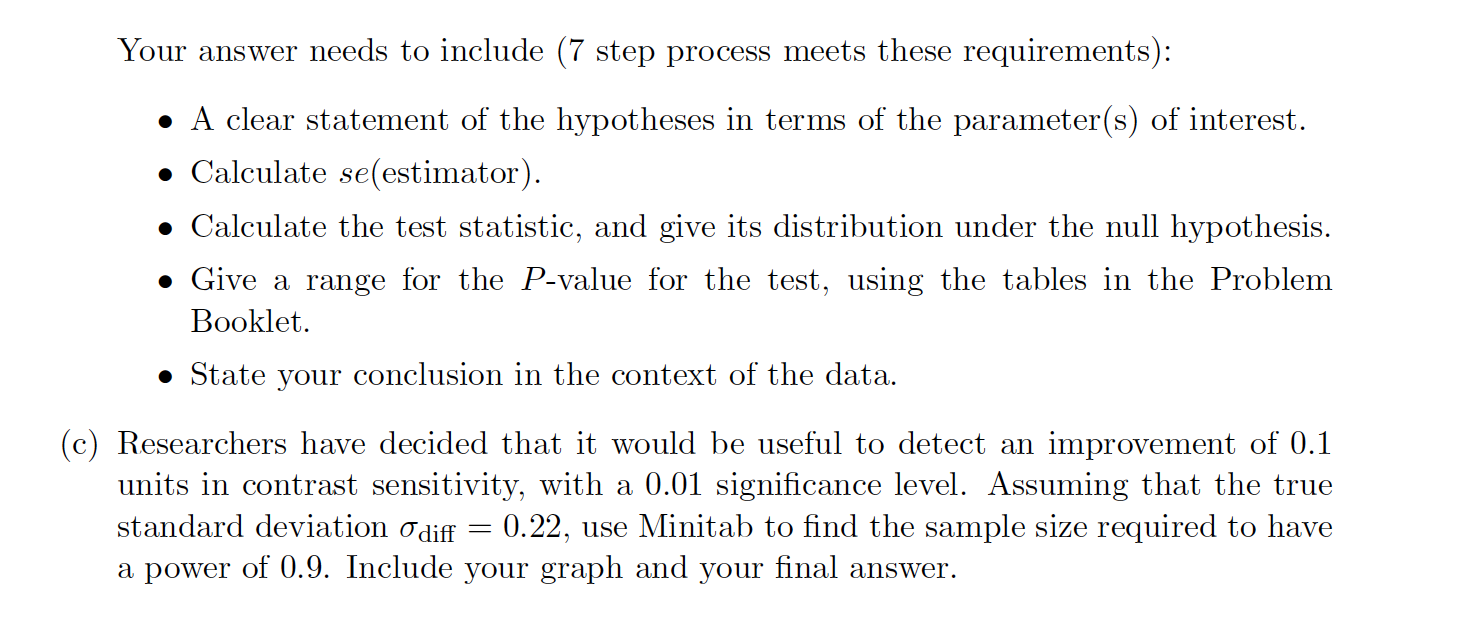
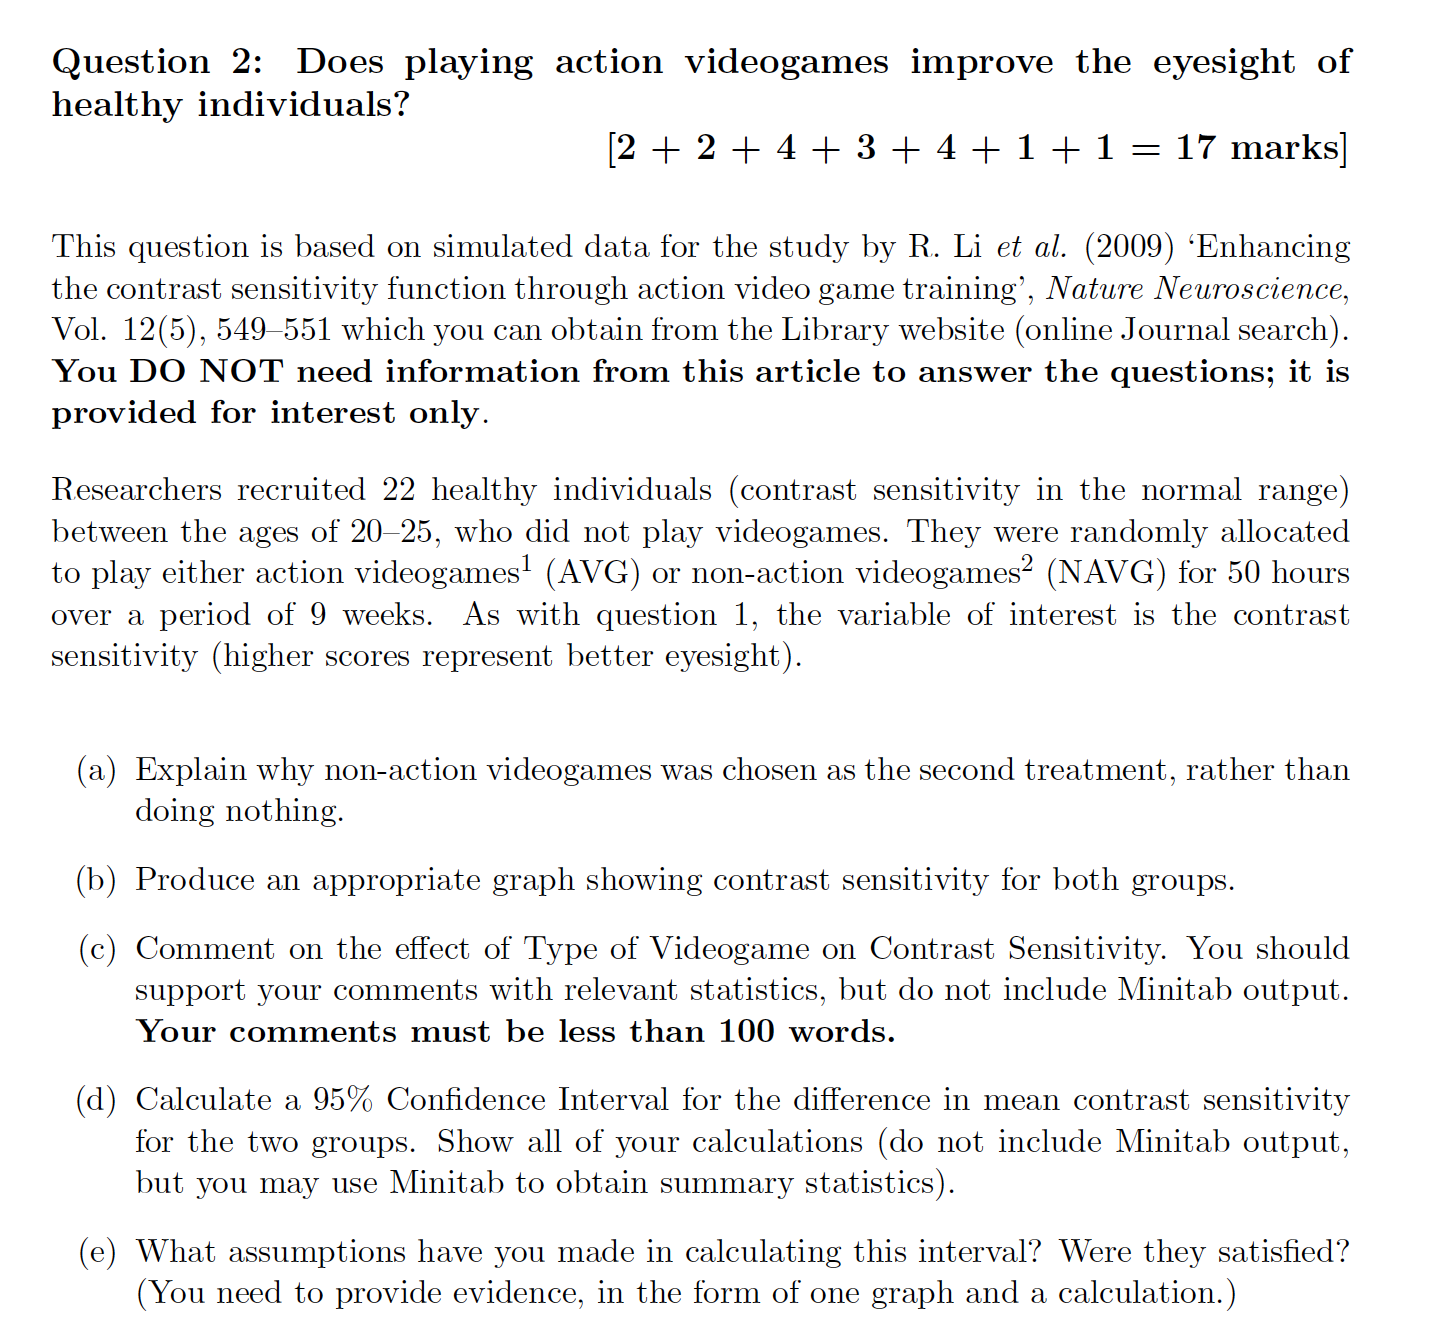
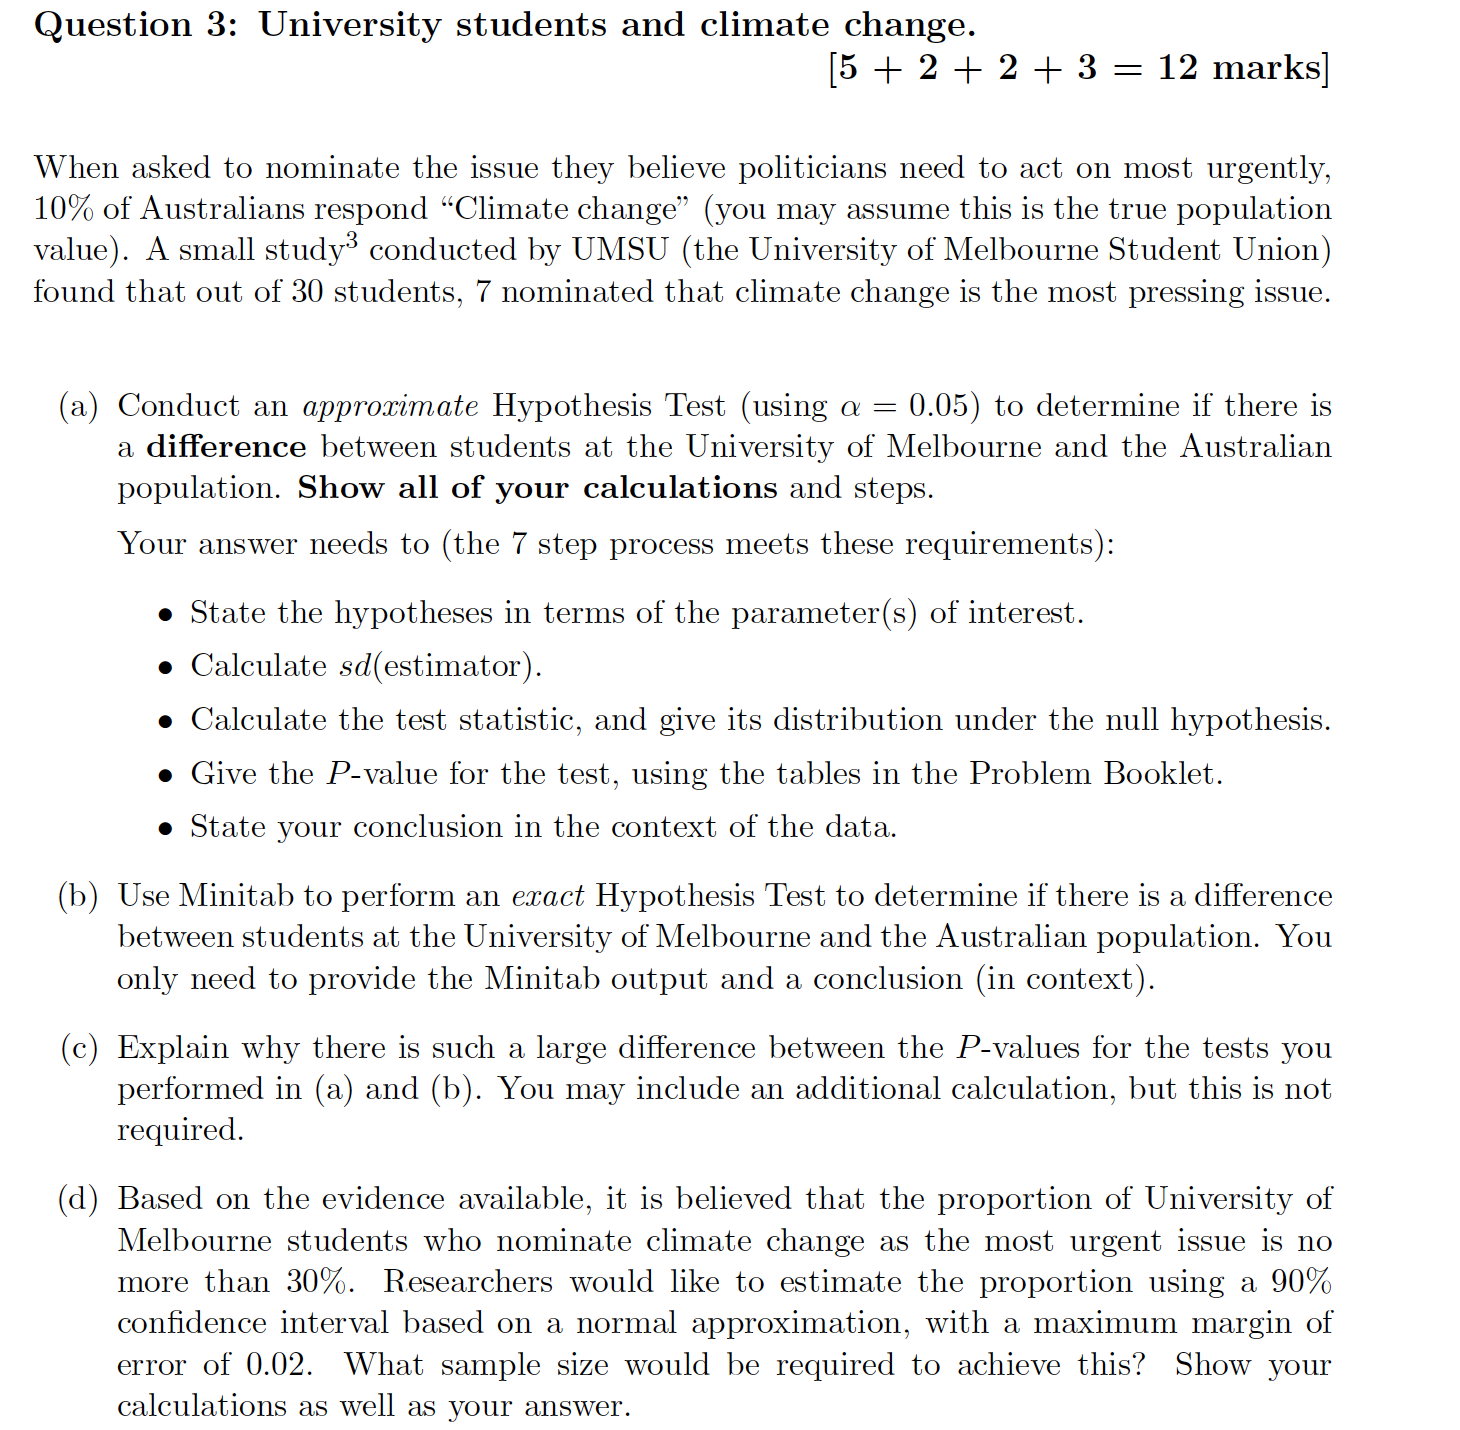
\fThe Variables: Column Name C1 Pre Contrast sensitivity scores for amblyopia patients at the start of the study. C2 Post Contrast sensitivity scores for amblyopia patients at the end of the study C3 AVG Contrast sensitivity scores for action videogame players C4 NAVG Contrast sensitivity scores for nonaction videogame players Question 1: Does playing a videogame help those with Amblyopia? [1+6l229marks] This question is based on simulated data for the study by ST. Jeon et at. (2012) 'The Effect of Video Game Training on the Vision of Adults with Bilateral Deprivation Ambly opia', Seeing and Perceiving, which you can read about here: https:/ / www.telegraph.co.uk / news / science / sciencenews / 9088262 / Playingvideo gamesimproves eyesighthtml (also linked on the Assignments page of the LMS). You DO NOT need the information from either of these articles to answer the questions; they are provided for interest only. Amblyopia (childhood cataracts) are an eye problem, present from a young age, which can be corrected using surgery and special contact lenses. However, their eyesight continues to function below average. The contrast sensitivity for each participant was measured before beginning the videogame training; they spent 40 hours playing 'Medal of Honor' over a onemonth period; and their contrast sensitivity was measured again. A higher value for contrast sensitivity represents better eyesight. (a) Explain why these data are paired. (b) Conduct a hypothesis test to determine whether there was an improvement in the participants' eyesight. You should use a signicance level of 04 = 0.01 for this test. You must show all calculations (do not include Minitab output, but you may use Minitab to obtain summary statistics). Your answer needs to include (7 step process meets these requirements): a A clear statement of the hypotheses in terms of the parameter(s) of interest. 0 Calculate se(estimator). 0 Calculate the test statistic, and give its distribution under the null hypothesis. 0 Give a range for the Pvalue for the test, using the tables in the Problem Booklet. 0 State your conclusion in the context of the data. (c) Researchers have decided that it would be useful to detect an improvement of 0.1 units in contrast sensitivity, with a 0.01 signicance level. Assuming that the true standard deviation Udiff = 0.22, use Minitab to nd the sample size required to have a power of 0.9. Include your graph and your nal answer. Question 2: Does playing action videogames improve the eyesight of healthy individuals? [2+2l4l3l4l1l1217marks] This question is based on simulated data for the study by R- Li et at. (2009) 'Enhancing the contrast sensitivity function through action video game training', N atUTB Neuroscience, Vol. 12(5), 549551 which you can obtain from the Library website (online Journal search). You DO NOT need information from this article to answer the questions; it is provided for interest only. Researchers recruited 22 healthy individuals (contrast sensitivity in the normal range) between the ages of 20725, who did not play videogames. They were randomly allocated to play either action videogames1 (AVG) or nonaction videogames2 (NAVG) for 50 hours over a period of 9 weeks. As with question 1, the variable of interest is the contrast sensitivity (higher scores represent better eyesight). (a) Explain why nonaction videogames was chosen as the second treatment, rather than doing nothing. (b) Produce an appropriate graph showing contrast sensitivity for both groups. (0) Comment on the effect of Type of Videogame on Contrast Sensitivity. You should support your comments with relevant statistics, but do not include Minitab output. Your comments must be less than 100 words. (d) Calculate a 95% Condence Interval for the difference in mean contrast sensitivity for the two groups. Show all of your calculations (do not include Minitab output, but you may use Minitab to obtain summary statistics). (e) What assumptions have you made in calculating this interval? Were they satised? (You need to provide evidence, in the form of one graph and a calculation.) Question 3: University students and climate change. [5+2+2+3=12marks] When asked to nominate the issue they believe politicians need to act on most urgently, 10% of Australians respond \"Climate change\" (you may assume this is the true population value). A small study3 conducted by UMSU (the University of Melbourne Student Union) found that out of 30 students, 7 nominated that climate change is the most pressing issue. (8) Conduct an approximate Hypothesis Test (using a = 0.05) to determine if there is a difference between students at the University of Melbourne and the Australian population. Show all of your calculations and steps. Your answer needs to (the 7 step process meets these requirements): a State the hypotheses in terms of the parameter(s) of interest. 0 Calculate sd(estimator). 0 Calculate the test statistic, and give its distribution under the null hypothesis. 0 Give the Pvalue for the test, using the tables in the Problem Booklet. 0 State your conclusion in the context of the data. Use Minitab to perform an ewact Hypothesis Test to determine if there is a difference between students at the University of Melbourne and the Australian population. You only need to provide the Minitab output and a conclusion (in context). Explain why there is such a large dierence between the Pvalues for the tests you performed in (a) and (b). You may include an additional calculation, but this is not required. Based on the evidence available, it is believed that the proportion of University of Melbourne students who nominate climate change as the most urgent issue is no more than 30%. Researchers would like to estimate the proportion using a 90% condence interval based on a normal approximation, with a maximum margin of error of 0.02. What sample size would be required to achieve this? Show your calculations as well as your