i cant fingure out the other parts. from income from continuing operations and on

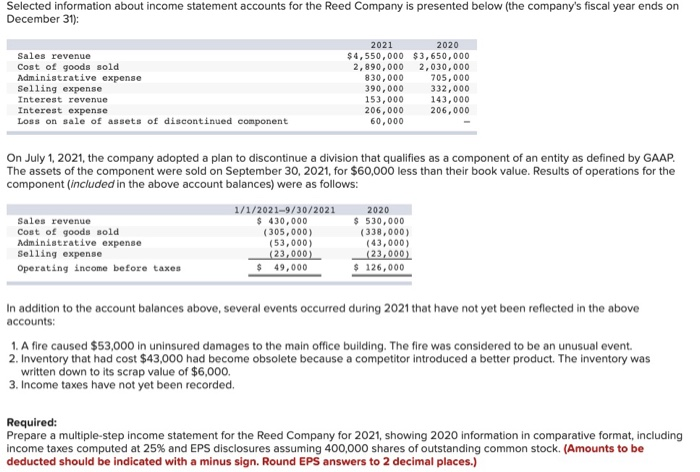
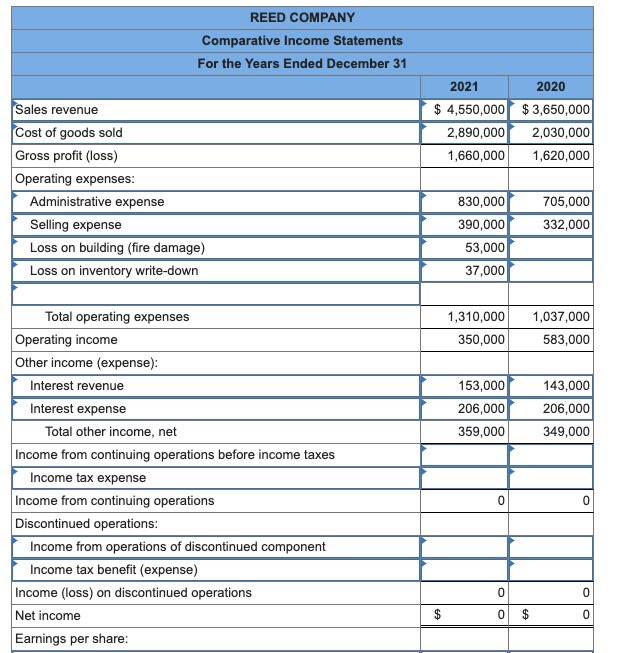
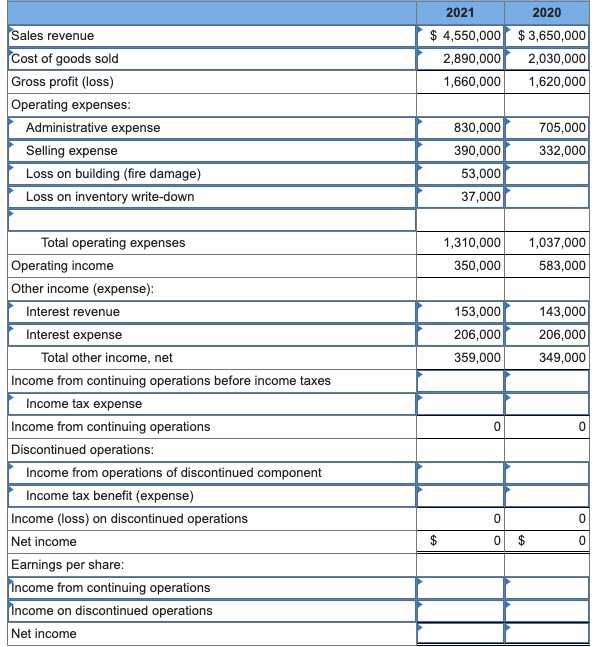
Selected information about income statement accounts for the Reed Company is presented below (the company's fiscal year ends on December 31): Sales revenue Cost of goods sold Administrative expense Selling expense Interest revenue Interest expense Loss on sale of assets of discontinued component 2021 2020 $4,550,000 $3,650,000 2.890.000 2.030,000 830,000 705,000 390,000 332,000 153,000 143,000 206,000 206,000 60,000 On July 1, 2021, the company adopted a plan to discontinue a division that qualifies as a component of an entity as defined by GAAP. The assets of the component were sold on September 30, 2021, for $60,000 less than their book value. Results of operations for the component (included in the above account balances) were as follows: Sales revenue Cost of goods sold Administrative expense Selling expense Operating income before taxes 1/1/2021-9/30/2021 $ 430,000 (305,000) (53,000) (23,000) $ 49,000 2020 $530,000 (338,000) (43,000) (23,000) $126.000 In addition to the account balances above, several events occurred during 2021 that have not yet been reflected in the above accounts: 1. A fire caused $53,000 in uninsured damages to the main office building. The fire was considered to be an unusual event. 2. Inventory that had cost $43,000 had become obsolete because a competitor introduced a better product. The inventory was written down to its scrap value of $6,000. 3. Income taxes have not yet been recorded. Required: Prepare a multiple-step income statement for the Reed Company for 2021, showing 2020 information in comparative format, including income taxes computed at 25% and EPS disclosures assuming 400,000 shares of outstanding common stock. (Amounts to be deducted should be indicated with a minus sign. Round EPS answers to 2 decimal places.) REED COMPANY Comparative Income Statements For the Years Ended December 31 2021 $ 4,550,000 2,890,000 1,660,000 2020 $3,650,000 2,030,000 1,620,000 Sales revenue Cost of goods sold Gross profit (loss) Operating expenses: Administrative expense Selling expense Loss on building (fire damage) Loss on inventory write-down 705,000 332,000 830,000 390,000 53,000 37,000 1,310,000 350,000 1,037,000 583,000 153,000 206,000 359,000 143,000 206,000 349,000 Total operating expenses Operating income Other income (expense): Interest revenue Interest expense Total other income, net Income from continuing operations before income taxes Income tax expense Income from continuing operations Discontinued operations: Income from operations of discontinued component Income tax benefit (expense) Income (loss) on discontinued operations Net income Earnings per share: $ 0 0 $ 2021 $ 4,550,000 2,890,000 1,660,000 2020 $3,650,000 2,030,000 1,620,000 Sales revenue Cost of goods sold Gross profit (loss) Operating expenses: Administrative expense Selling expense Loss on building (fire damage) Loss on inventory write-down 705,000 332,000 830,000 390,000 53,000 37,000 Total operating expenses 1,310,000 350,000 1,037,000 583,000 153,000 206,000 359,000 143,000 206,000 349,000 Operating income Other income (expense): Interest revenue Interest expense Total other income, net Income from continuing operations before income taxes Income tax expense Income from continuing operations Discontinued operations: Income from operations of discontinued component Income tax benefit (expense) Income (loss) on discontinued operations Net income Earnings per share: Income from continuing operations Income on discontinued operations Net income $ 0 $


