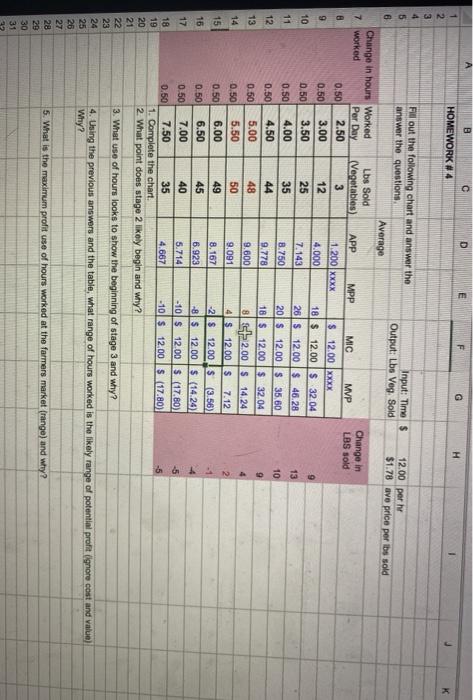
i completed the chart but i am struggling answering the questions
A > m F G D H HOMEWORK #4 2 3 4 Fill out the following chart and answer the 5 Input: Time $ answer the questions, 12.00 per le Output: Lbs Veg. Sold $1.78 ave price per bs sold 6 Average Change in hours Worked Lbs Sold 7 worked Per Day (Vegetables) Change in APP MPP MIC MVP LBS sold 0.50 2.50 3 1.200 xxxx $ 12.00 xxxx 9 0.50 3.00 12 4.000 18 $ 12.00$ 32.04 9 10 0.50 3.50 25 7.143 26 5 12.00 $ 46.28 13 11 0.50 4.00 35 8.750 20 $ 12.00$ 35.60 10 12 0.50 4.50 44 9.778 18 $ 12.00$ 32.04 9 13 0.50 5.00 48 9.600 8 +2,00 S 14.24 14 0.50 5.50 50 9.091 4 $12.00 $ 7.12 2 15 0.50 6.00 49 8.167 -2 $ 12.00$ (3.56) -1 16 0.50 6.50 45 6.923 -8 $ 12.00$ (1424) 4 17 0.50 7.00 40 5.714 -10 $ 12.00$ (17.80) 18 0.50 7.50 35 4.667 -10 $ 12,00 S (17.80) -5 19 1. Complete the chart 20 2. What point does stage 2 likely begin and why? 21 22 3. What use of hours looks to show the beginning of stage 3 and why? 23 24 4. Using the previous answers and the table, what range of hours worked is the likely range of potential profit ignore cost and Value) 25 Why? 26 27 28 5. What is the maximum profit use of hours worked at the farmers market (range) and why? 29 30 31 -5 A > m F G D H HOMEWORK #4 2 3 4 Fill out the following chart and answer the 5 Input: Time $ answer the questions, 12.00 per le Output: Lbs Veg. Sold $1.78 ave price per bs sold 6 Average Change in hours Worked Lbs Sold 7 worked Per Day (Vegetables) Change in APP MPP MIC MVP LBS sold 0.50 2.50 3 1.200 xxxx $ 12.00 xxxx 9 0.50 3.00 12 4.000 18 $ 12.00$ 32.04 9 10 0.50 3.50 25 7.143 26 5 12.00 $ 46.28 13 11 0.50 4.00 35 8.750 20 $ 12.00$ 35.60 10 12 0.50 4.50 44 9.778 18 $ 12.00$ 32.04 9 13 0.50 5.00 48 9.600 8 +2,00 S 14.24 14 0.50 5.50 50 9.091 4 $12.00 $ 7.12 2 15 0.50 6.00 49 8.167 -2 $ 12.00$ (3.56) -1 16 0.50 6.50 45 6.923 -8 $ 12.00$ (1424) 4 17 0.50 7.00 40 5.714 -10 $ 12.00$ (17.80) 18 0.50 7.50 35 4.667 -10 $ 12,00 S (17.80) -5 19 1. Complete the chart 20 2. What point does stage 2 likely begin and why? 21 22 3. What use of hours looks to show the beginning of stage 3 and why? 23 24 4. Using the previous answers and the table, what range of hours worked is the likely range of potential profit ignore cost and Value) 25 Why? 26 27 28 5. What is the maximum profit use of hours worked at the farmers market (range) and why? 29 30 31 -5
 i completed the chart but i am struggling answering the questions


