Question
Create a schedule, using good form, which shows the percentages of how each overhead cost account should be allocated to each of the four ABC
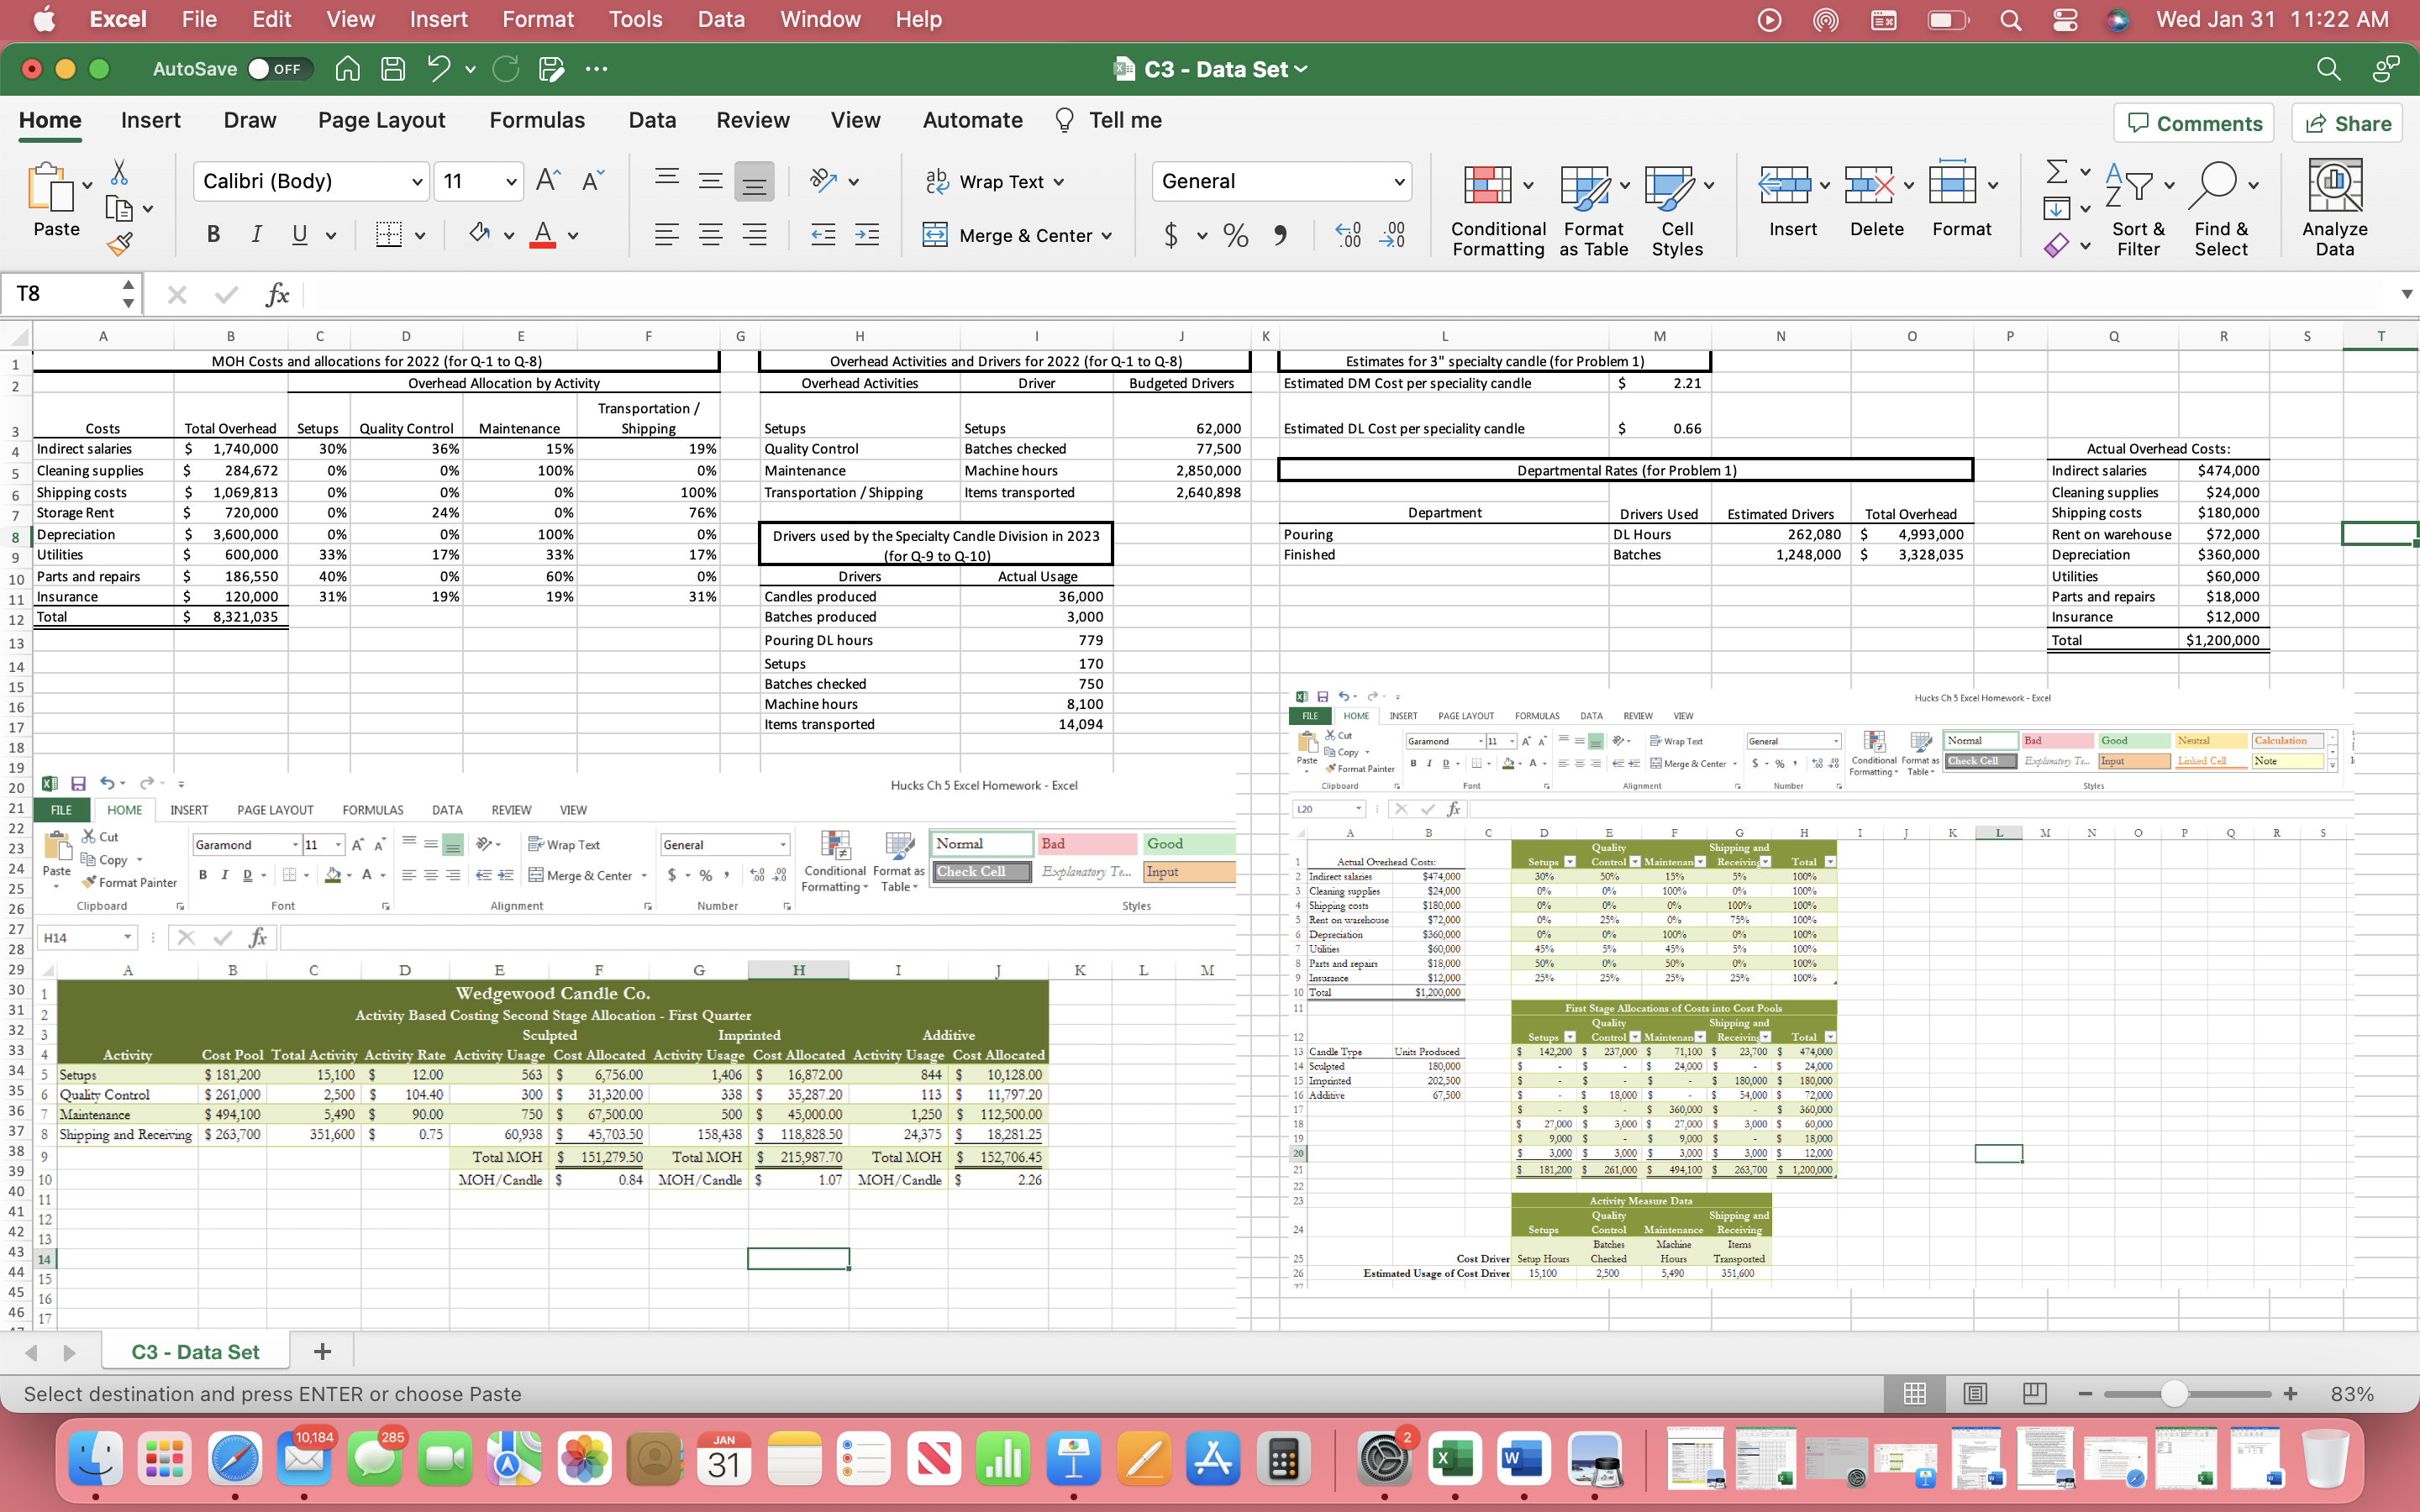
Create a schedule, using good form, which shows the percentages of how each overhead cost account should be allocated to each of the four ABC cost activities. You may manually type in the appropriate percentages within this table. Include a Total column within the table to ensure percentages add up to use a formula Format this schedule using the Table formatting tool so that dropdown menus are added to facilitate sorting
1.Create a schedule, using formulas only and good form, that shows the dollar amounts from the actual overhead costs table that should be attributable to each of the four ABC activities, based on the percentages identified inabove. Include a Total column within the table to ensure the amount allocated across the four activity pools equals the total from the initial .Actual Overhead Costs schedule for each line item, as well as a total row to identify the total amount of overhead cost attributable to each pool. Format this schedule using the Table formatting tool so that dropdown menus are added to facilitate sorting.
2. In an appropriate area manually type in the cost driver information both names of the drivers and last year quantities for each of the four activity cost pools. Please note that the driver for the Setups pool is Setup hours and not Setupas inappropriately indicated within the Driver Activity, Past and Present document from within the chapter.
Assume Wedgewood produced sculpted candles, imprinted candles, and additive candles. In an appropriate area manually type in the total units in candles produced of each candle type Add a new worksheet and name it Applied OverheadOn this worksheet. Calculate and appropriately label the activity predetermined overhead rate for each of the four cost pools.Create a schedule, using good form without using the Table formatting tool that shows the second stage allocation of overhead to the three lines of specialty candles for the first quarter of the year. Total the amount of overhead allocated to each specialty candle type. Calculate the amount of manufacturing overhead allocated per candle for each specialty candle type.
Excel File Edit View Insert Format Tools Data Window Help O Wed Jan 31 11:22 AM AutoSave OFF Home Insert Draw Page Layout Formulas Data Review View Automate Paste Calibri (Body) BIU 11 A A ab ab Wrap Text C3 - Data Set Tell me General Comments Share A Merge & Center $ % .00 .00 0 Conditional Format Cell Formatting as Table Styles Insert Delete Format Sort & Filter Find & Select Analyze Data T8 A B 1 2 fx D E F G H MOH Costs and allocations for 2022 (for Q-1 to Q-8) Overhead Allocation by Activity Overhead Activities and Drivers for 2022 (for Q-1 to Q-8) Overhead Activities Driver 345698 Costs Indirect salaries Total Overhead Setups Quality Control Maintenance Transportation / Shipping Setups $ 1,740,000 30% Cleaning supplies $ 284,672 0% 36% 0% 15% 100% 19% 0% Quality Control Maintenance 6 Shipping costs $ 1,069,813 0% 0% 0% 100% Transportation/Shipping Setups Batches checked Machine hours Items transported Storage Rent $ 720,000 0% 24% 0% 76% Depreciation $ 3,600,000 0% 0% 100% 0% Drivers used by the Specialty Candle Division in 2023 9 Utilities $ 600,000 33% 17% 33% 17% (for Q-9 to Q-10) 10 Parts and repairs $ 186,550 40% 0% 60% 0% Drivers 11 Insurance $ 120,000 31% 19% 19% 31% Candles produced 12 Total $ 8,321,035 Batches produced Actual Usage 36,000 3,000 13 Pouring DL hours 779 J K M N P Q R S T Budgeted Drivers Estimates for 3" specialty candle (for Problem 1) Estimated DM Cost per speciality candle $ 2.21 62,000 77,500 Estimated DL Cost per speciality candle $ 0.66 2,850,000 Departmental Rates (for Problem 1) 2,640,898 Department Drivers Used Pouring Finished DL Hours Batches Estimated Drivers Total Overhead 262,080 $ 4,993,000 1,248,000 $ 3,328,035 Indirect salaries Cleaning supplies Shipping costs Rent on warehouse Actual Overhead Costs: $474,000 $24,000 $180,000 Depreciation Utilities $72,000 $360,000 $60,000 Parts and repairs $18,000 Insurance Total $12,000 $1,200,000 14 Setups 170 Batches checked 750 15 A Hucks Ch 5 Excel Homework - Excel Machine hours 8,100 16 FILE HOME INSERT PAGE LAYOUT FORMULAS DATA REVIEW VIEW 17 Items transported 14,094 Cut Garamond 11 18 Copy Paste BID- FF - A A A- Wrap Text General = = = Merge Center 19 20 21 22 23 X A FILE 24 Paste Cut Copy Format Painter Clipboard Hucks Ch 5 Excel Homework - Excel Format Painter Clipboard +00+00 Conditional Format as Formatting Table- Normal Check Cell Bad Good Explanatory Te... Input Neutral Linked Cell Calculation Note G Font Alignment G Number Styles L20 fx A B C D HOME INSERT PAGE LAYOUT FORMULAS DATA REVIEW VIEW E F G H I J K L M N P Q R S Garamond 11 Wrap Text General Normal Bad Good Quality Shipping and Actual Overhead Costs: Setups Control Maintenan Receiving Total BID A- Merge & Center - $ % " 25 Conditional Format as Check Cell Formatting Table Explanatory Te... Input 2 Indirect salaries $474,000 30% 50% 15% 5% 100% 3 Cleaning supplies $24,000 0% 0% 100% 0% 100% Font Alignment Number Styles 4 Shipping costs $180,000 0% 0% 0% 100% 100% 26 Rent on warehouse $72,000 0% 25% 0% 75% 100% 27 H14 x fx Depreciation $360,000 0% 0% 100% 0% 100% Utilities $60,000 45% 5% 45% 5% 100% 28 8 Parts and repairs $18,000 50% 0% 50% 0% 100% 29 A B D E H I J K L M 9 Insurance $12,000 25% 25% 25% 25% 100% 30 1 Wedgewood Candle Co. 10 Total $1,200,000 11 31 2 32 3 33 4 Activity 34 5 Setups 15,100 $ 12.00 563 $ 6,756.00 35 6 Quality Control $261,000 2,500 $ 104.40 36 7 Maintenance $ 494,100 37 8 Shipping and Receiving $263,700 5,490 $ 351,600 $ 90.00 0.75 38 9 39 10 300 $ 750 $ 60,938 $ Total MOH $ MOH/Candle $ 31,320.00 67,500.00 45,703.50 151,279.50 Activity Based Costing Second Stage Allocation - First Quarter Sculpted Cost Pool Total Activity Activity Rate Activity Usage Cost Allocated Activity Usage Cost Allocated Activity Usage Cost Allocated $181,200 844 $ 10,128.00 113 $ 11,797.20 1,250 $112,500.00 24,375 $ 18,281.25 Total MOH $ 152,706.45 MOH/Candle $ Imprinted Additive 1,406 $ 16,872.00 338 $ 500 $ 35,287.20 45,000.00 158,438 $118,828.50 Total MOH $ 215,987.70 0.84 MOH/Candle $ 1.07 40 Quality 12 Setups 13 Candle Type Units Produced $ 142,200 $ 237,000 $ 71,100 $ 23,700 $ 474,000 14 Sculpted 180,000 $ $ - $ 24,000 $ $ 24,000 15 Imprinted 202,500 $ $ - $ 16 Additive 67,500 $ $ 18,000 $ $ 54,000 $ 72,000 17 $ $ $ 360,000 $ $ 360,000 18 $ 27,000 $ 3,000 $ 19 $ 9,000 $ - $ 20 $ 3,000 $ 3,000 $ 27,000 $ 9,000 $ 3,000 $ 3,000 $ 60,000 $ 18,000 3,000 $ 12.000 21 $ 181,200 $ 261,000 $ 494,100 263,700 1,200,000 2.26 22 23 First Stage Allocations of Costs into Cost Pools Shipping and Control Maintenan Receiving Total $ 180,000 $ 180,000 11 41 12 24 42 13 43 14 44 15 Shipping and Setups Control Maintenance Batches Receiving 25 Cost Driver Setup Hours Checked Machine Hours 26 Estimated Usage of Cost Driver 15,100 2,500 5,490 Items Transported 351,600 27 Activity Measure Data Quality 45 16 46 17 C3 Data Set Select destination and press ENTER or choose Paste 10,184 285 2 JAN 31 /A W + 83%
Step by Step Solution
There are 3 Steps involved in it
Step: 1

Get Instant Access to Expert-Tailored Solutions
See step-by-step solutions with expert insights and AI powered tools for academic success
Step: 2

Step: 3

Ace Your Homework with AI
Get the answers you need in no time with our AI-driven, step-by-step assistance
Get Started


