

Answered step by step
Verified Expert Solution
Question
1 Approved Answer
I desparately need help with the cleaning and table scraping for this question please help. THe biggest issue is getting the scraped data into a
 I desparately need help with the cleaning and table scraping for this question please help. THe biggest issue is getting the scraped data into a workable form, please help.
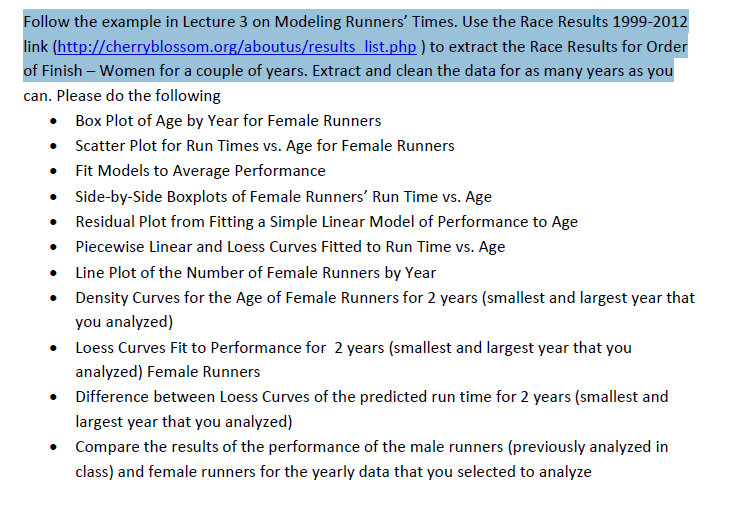
Follow the example in Lecture 3 on Modeling Runners' Times. Use the Race Results 1999-2012 link (http://cherryblossom.org/aboutus/results_ list.php) to extract the Race Results for Order of Finish - Women for a couple of years. Extract and clean the data for as many years as you can. Please do the following .Box Plot of Age by Year for Female Runners .Scatter Plot for Run Times vs. Age for Female Runners . Fit Models to Average Performance Side-by-Side Boxplots of Female Runners' Run Time vs. Age .Residual Plot from Fitting a Simple Linear Model of Performance to Age .Piecewise Linear and Loess Curves Fitted to Run Time vs. Age . Line Plot of the Number of Female Runners by Year Density Curves for the Age of Female Runners for 2 years (smallest and largest year that you analyzed) Loess Curves Fit to Performance for 2 years (smallest and largest year that you analyzed) Female Runners Difference between Loess Curves of the predicted run time for 2 years (smallest and largest year that you analyzed) Compare the results of the performance of the male runners (previously analyzed in class) and female runners for the yearly data that you selected to analyze Follow the example in Lecture 3 on Modeling Runners' Times. Use the Race Results 1999-2012 link (http://cherryblossom.org/aboutus/results_ list.php) to extract the Race Results for Order of Finish - Women for a couple of years. Extract and clean the data for as many years as you can. Please do the following .Box Plot of Age by Year for Female Runners .Scatter Plot for Run Times vs. Age for Female Runners . Fit Models to Average Performance Side-by-Side Boxplots of Female Runners' Run Time vs. Age .Residual Plot from Fitting a Simple Linear Model of Performance to Age .Piecewise Linear and Loess Curves Fitted to Run Time vs. Age . Line Plot of the Number of Female Runners by Year Density Curves for the Age of Female Runners for 2 years (smallest and largest year that you analyzed) Loess Curves Fit to Performance for 2 years (smallest and largest year that you analyzed) Female Runners Difference between Loess Curves of the predicted run time for 2 years (smallest and largest year that you analyzed) Compare the results of the performance of the male runners (previously analyzed in class) and female runners for the yearly data that you selected to analyze
Step by Step Solution
There are 3 Steps involved in it
Step: 1

Get Instant Access to Expert-Tailored Solutions
See step-by-step solutions with expert insights and AI powered tools for academic success
Step: 2

Step: 3
Ace Your Homework with AI
Get the answers you need in no time with our AI-driven, step-by-step assistance
Get Started
Database Processing Fundamentals Design And Implementation
Authors: KROENKE DAVID M.
1st Edition
8120322258, 978-8120322257