

Question
I do not understand what the GDP is telling me as of July 30. What is happening? Can you interpret in detail why GDP is
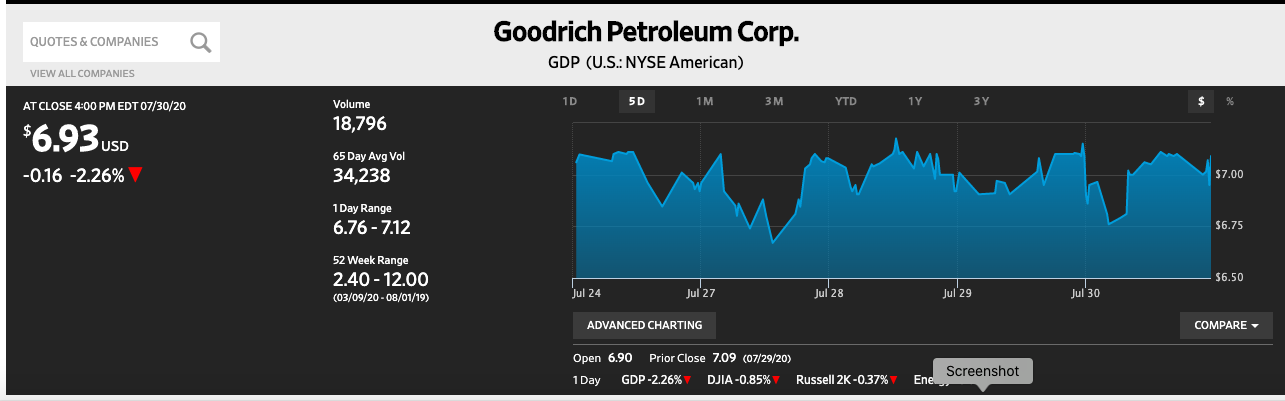 I do not understand what the GDP is telling me as of July 30. What is happening? Can you interpret in detail why GDP is down as of July 30? Can you explain what this chart is telling us?
I'll really appreciate it!
QUOTES & COMPANIES Goodrich Petroleum Corp. GDP (U.S.: NYSE American) VIEW ALL COMPANIES 1D 5D 1M 3M AT CLOSE 4:00 PM EDT 07/30/20 YTD 17 3 Y Volume 18,796 $6.93 USD -0.16 -2.26% 65 Day Avg Vol 34,238 $7.00 1 Day Range 6.76-7.12 $6.75 52 Week Range 2.40-12.00 (03/09/20 - 08/01/19) $6.50 Jul 24 Jul 27 Jul 28 Jul 29 Jul 30 ADVANCED CHARTING COMPARE - Open 6.90 Prior Close 7.09 (07/29/20) 1 Day GDP-2.26% DJIA -0.85% Russell 2K-0.37% Screenshot EnelStep by Step Solution
There are 3 Steps involved in it
Step: 1

Get Instant Access to Expert-Tailored Solutions
See step-by-step solutions with expert insights and AI powered tools for academic success
Step: 2

Step: 3
Ace Your Homework with AI
Get the answers you need in no time with our AI-driven, step-by-step assistance
Get Started
Essential Personal Finance A Practical Guide For Students
Authors: Lien Luu, Jonquil Lowe, Jason Butler, Tony Byrne
1st Edition
1138692956, 978-1138692954