

Question
I done with the first 3 but for number 4 I got an error ( matlab said the vectors must have same length) here is
 I done with the first 3 but for number 4 I got an error ( matlab said the vectors must have same length) here is the code that I use
x_nodes = [1977 1980 1990 1995 2000 2005 2010]; y_values = [698840 907701 3233313 4973983 5674178 7932710 13561623]; x_eval = [1960 1985 2015]; divdif_y = divdif(x_nodes,y_values) p_eval = interp(x_nodes,divdif_y,x_eval) x = [1970:1:2015]; y = interp(x_nodes, divdif_y, x); figure(1), plot (x,y,x_nodes,y_values)
Thank you
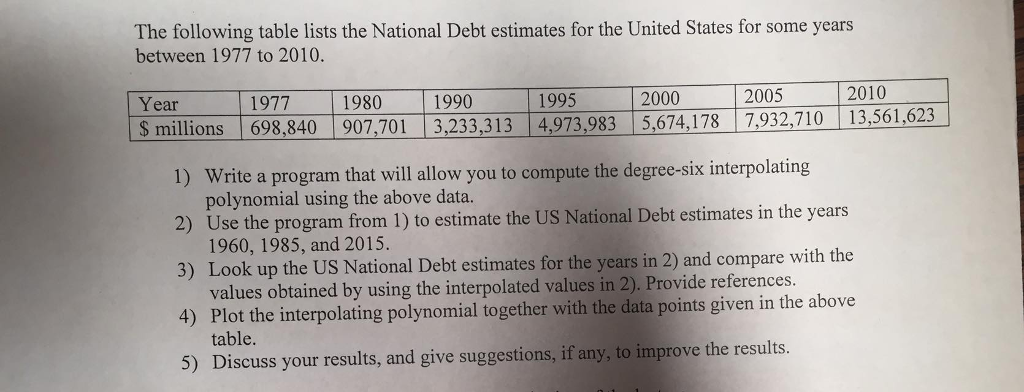
The following table lists the National Debt estimates for the United States for some years between 1977 to 2010. Year 1977 1980 1990 1995 2000 2005 2010 $ millions 698,840 907,701-233,313 4.973.983 5,674, 178 7.932,710-13561,623 1) 2) Use the program from 1) to estimate the US National Debt estimates in the years 3) Look up the US National Debt estimates for the years in 2) and compare with the 4) Plot the interpolating polynomial together with the data points given in the above 5) Discuss your results, and give suggestions, if any, to improve the results Write a program that will allow you to compute the degree-six interpolating polynomial using the above data. 1960, 1985, and 2015. values obtained by using the interpolated values in 2). Provide references. table
Step by Step Solution
There are 3 Steps involved in it
Step: 1

Get Instant Access to Expert-Tailored Solutions
See step-by-step solutions with expert insights and AI powered tools for academic success
Step: 2

Step: 3
Ace Your Homework with AI
Get the answers you need in no time with our AI-driven, step-by-step assistance
Get Started
Introductory Relational Database Design For Business With Microsoft Access
Authors: Jonathan Eckstein, Bonnie R. Schultz
1st Edition
1119329418, 978-1119329411