

Answered step by step
Verified Expert Solution
Question
1 Approved Answer
I don't need help with questions 1 or 2 but would like an in-depth explanation of question 3 and 4 and to know how to
I don't need help with questions 1 or 2 but would like an in-depth explanation of question 3 and 4 and to know how to reflect the changes mentioned in the memo in the budget analysis.
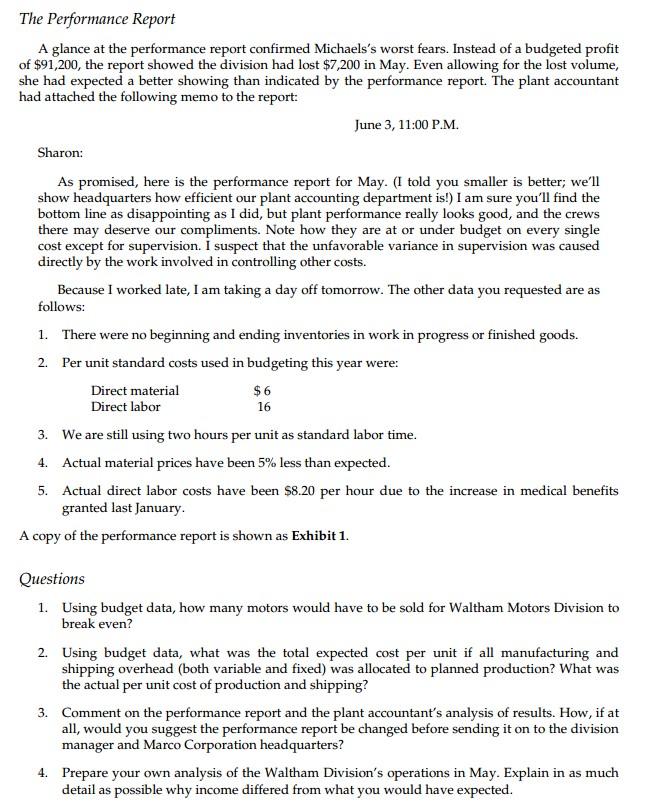
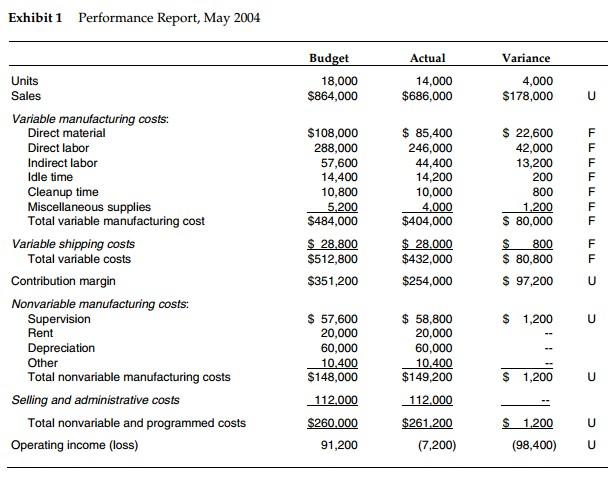
The Performance Report A glance at the performance report confirmed Michaels's worst fears. Instead of a budgeted profit of $91,200, the report showed the division had lost $7,200 in May. Even allowing for the lost volume, she had expected a better showing than indicated by the performance report. The plant accountant had attached the following memo to the report: June 3, 11:00 P.M. Sharon: As promised, here is the performance report for May. (I told you smaller is better; we'll show headquarters how efficient our plant accounting department is!) I am sure you'll find the bottom line as disappointing as I did, but plant performance really looks good, and the crews there may deserve our compliments. Note how they are at or under budget on every single cost except for supervision. I suspect that the unfavorable variance in supervision was caused directly by the work involved in controlling other costs. Because I worked late, I am taking a day off tomorrow. The other data you requested are as follows: 1. There were no beginning and ending inventories in work in progress or finished goods. 2. Per unit standard costs used in budgeting this year were: Direct material Direct labor 16 3. We are still using two hours per unit as standard labor time. 4. Actual material prices have been 5% less than expected. 5. Actual direct labor costs have been $8.20 per hour due to the increase in medical benefits granted last January A copy of the performance report is shown as Exhibit 1. $6 Questions 1. Using budget data, how many motors would have to be sold for Waltham Motors Division to break even? 2. Using budget data, what was the total expected cost per unit if all manufacturing and shipping overhead (both variable and fixed) was allocated to planned production? What was the actual per unit cost of production and shipping? 3. Comment on the performance report and the plant accountant's analysis of results. How, if at all, would you suggest the performance report be changed before sending it on to the division manager and Marco Corporation headquarters? 4. Prepare your own analysis of the Waltham Division's operations in May. Explain in as much detail as possible why income differed from what you would have expected. Exhibit 1 Performance Report, May 2004 Variance Budget 18,000 $864,000 Actual 14,000 $686,000 4,000 $178,000 U $108,000 288,000 57,600 14,400 10,800 5.200 $484,000 $ 28.800 $512,800 $351,200 $ 85,400 246,000 44,400 14,200 10,000 4.000 $404,000 $ 28,000 $432,000 $254,000 Units Sales Variable manufacturing costs: Direct material Direct labor Indirect labor Idle time Cleanup time Miscellaneous supplies Total variable manufacturing cost Variable shipping costs Total variable costs Contribution margin Nonvariable manufacturing costs: Supervision Rent Depreciation Other Total nonvariable manufacturing costs Selling and administrative costs Total nonvariable and programmed costs Operating income (loss) $ 22,600 42,000 13,200 200 800 1.200 $ 80,000 $ 800 $ 80.800 $ 97,200 F F F F F F F LLLLLLLLL TIT F F U $ 1,200 U $ 57,600 20,000 60,000 10,400 $148,000 112.000 $260.000 91,200 $ 58,800 20,000 60,000 10.400 $149,200 112.000 $261.200 (7,200) $ 1,200 U U $ 1.200 (98,400) U The Performance Report A glance at the performance report confirmed Michaels's worst fears. Instead of a budgeted profit of $91,200, the report showed the division had lost $7,200 in May. Even allowing for the lost volume, she had expected a better showing than indicated by the performance report. The plant accountant had attached the following memo to the report: June 3, 11:00 P.M. Sharon: As promised, here is the performance report for May. (I told you smaller is better; we'll show headquarters how efficient our plant accounting department is!) I am sure you'll find the bottom line as disappointing as I did, but plant performance really looks good, and the crews there may deserve our compliments. Note how they are at or under budget on every single cost except for supervision. I suspect that the unfavorable variance in supervision was caused directly by the work involved in controlling other costs. Because I worked late, I am taking a day off tomorrow. The other data you requested are as follows: 1. There were no beginning and ending inventories in work in progress or finished goods. 2. Per unit standard costs used in budgeting this year were: Direct material Direct labor 16 3. We are still using two hours per unit as standard labor time. 4. Actual material prices have been 5% less than expected. 5. Actual direct labor costs have been $8.20 per hour due to the increase in medical benefits granted last January A copy of the performance report is shown as Exhibit 1. $6 Questions 1. Using budget data, how many motors would have to be sold for Waltham Motors Division to break even? 2. Using budget data, what was the total expected cost per unit if all manufacturing and shipping overhead (both variable and fixed) was allocated to planned production? What was the actual per unit cost of production and shipping? 3. Comment on the performance report and the plant accountant's analysis of results. How, if at all, would you suggest the performance report be changed before sending it on to the division manager and Marco Corporation headquarters? 4. Prepare your own analysis of the Waltham Division's operations in May. Explain in as much detail as possible why income differed from what you would have expected. Exhibit 1 Performance Report, May 2004 Variance Budget 18,000 $864,000 Actual 14,000 $686,000 4,000 $178,000 U $108,000 288,000 57,600 14,400 10,800 5.200 $484,000 $ 28.800 $512,800 $351,200 $ 85,400 246,000 44,400 14,200 10,000 4.000 $404,000 $ 28,000 $432,000 $254,000 Units Sales Variable manufacturing costs: Direct material Direct labor Indirect labor Idle time Cleanup time Miscellaneous supplies Total variable manufacturing cost Variable shipping costs Total variable costs Contribution margin Nonvariable manufacturing costs: Supervision Rent Depreciation Other Total nonvariable manufacturing costs Selling and administrative costs Total nonvariable and programmed costs Operating income (loss) $ 22,600 42,000 13,200 200 800 1.200 $ 80,000 $ 800 $ 80.800 $ 97,200 F F F F F F F LLLLLLLLL TIT F F U $ 1,200 U $ 57,600 20,000 60,000 10,400 $148,000 112.000 $260.000 91,200 $ 58,800 20,000 60,000 10.400 $149,200 112.000 $261.200 (7,200) $ 1,200 U U $ 1.200 (98,400) UStep by Step Solution
There are 3 Steps involved in it
Step: 1

Get Instant Access to Expert-Tailored Solutions
See step-by-step solutions with expert insights and AI powered tools for academic success
Step: 2

Step: 3
Ace Your Homework with AI
Get the answers you need in no time with our AI-driven, step-by-step assistance
Get Started
Nike Inc Strategic Audit SWOT Pestle Competitor And Financial Analysis
Authors: Bankim Chandra Pandey
1st Edition
1973352516, 978-1973352518