I don't need help with the memo, just the ratio anaylsis
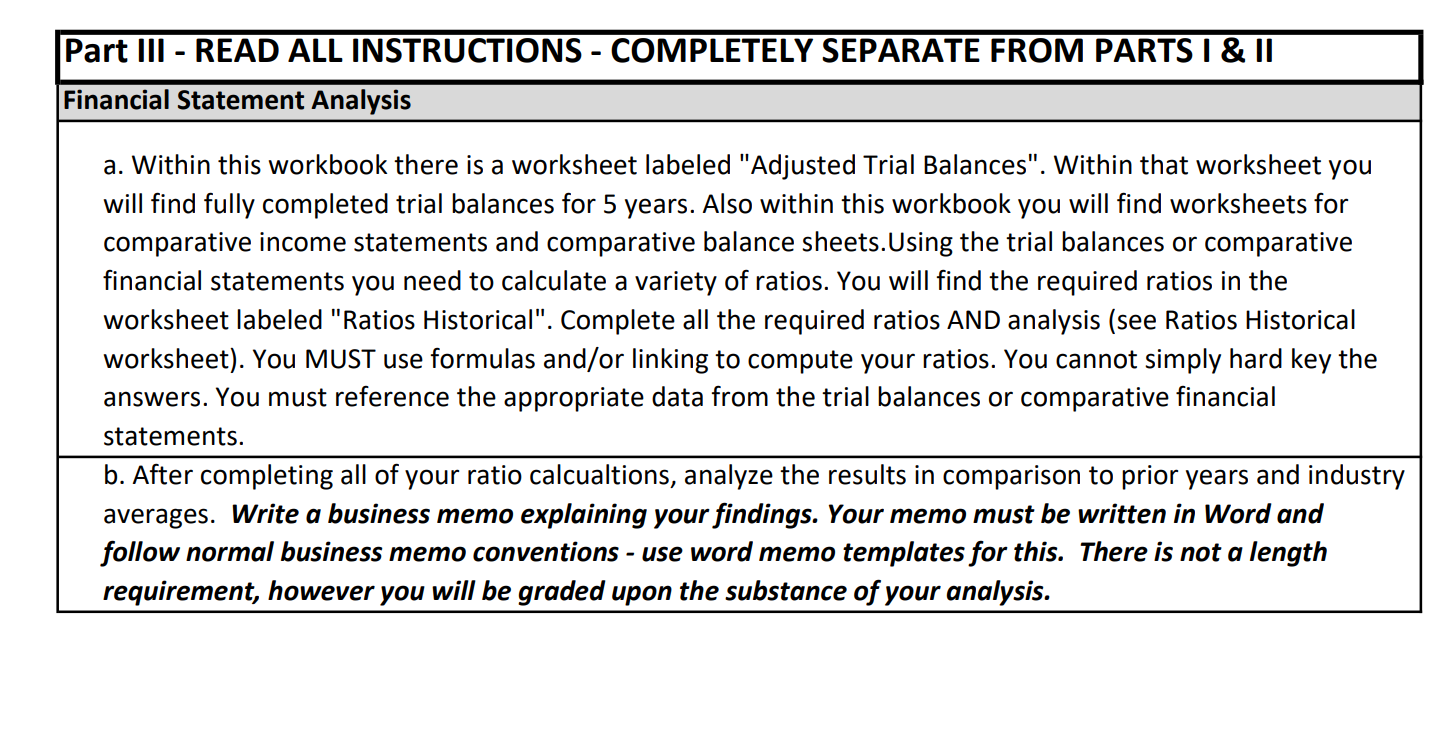
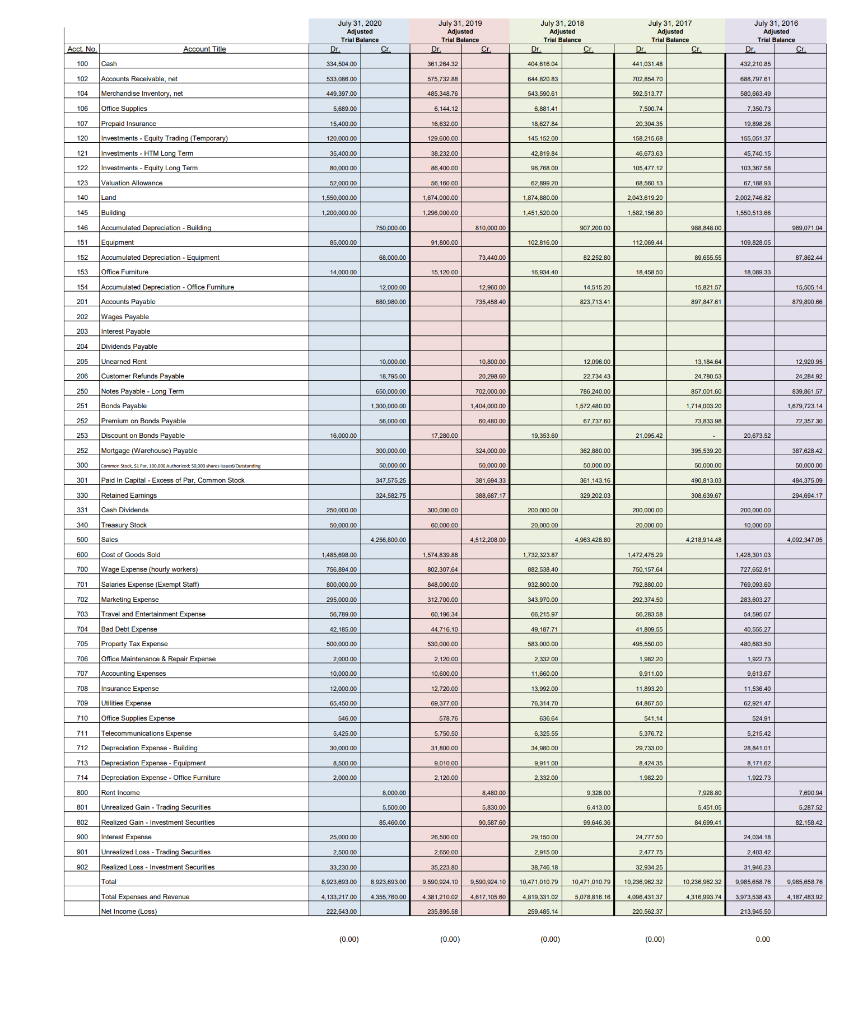
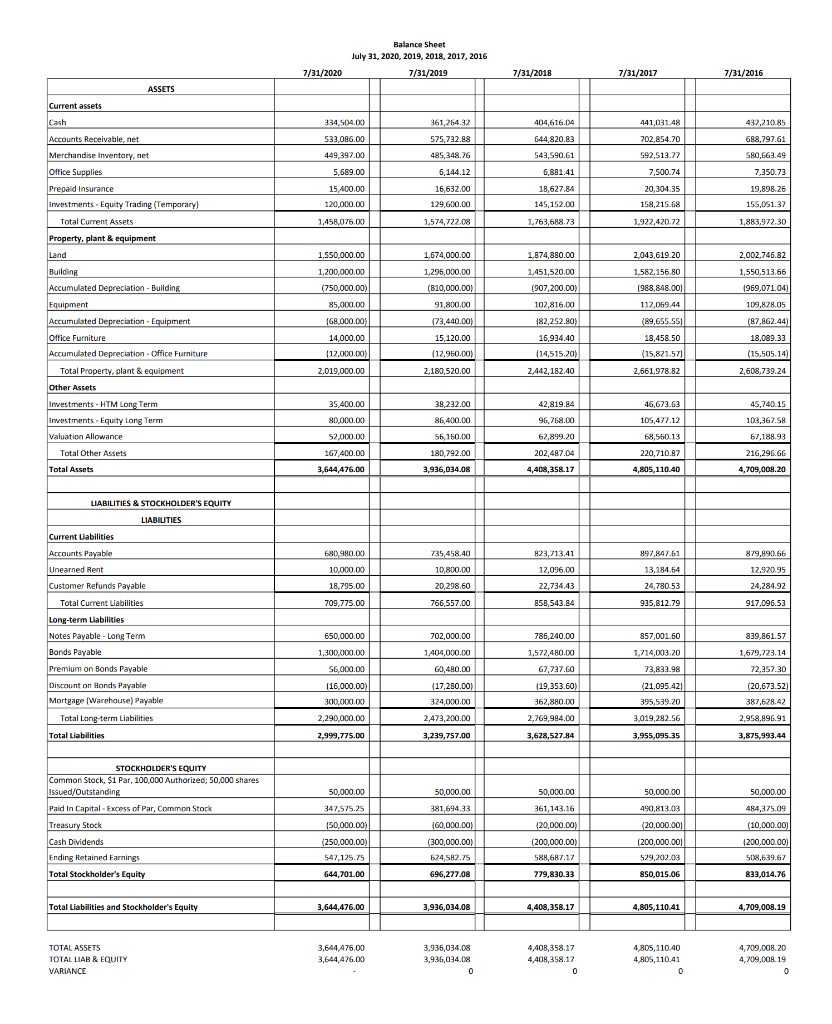
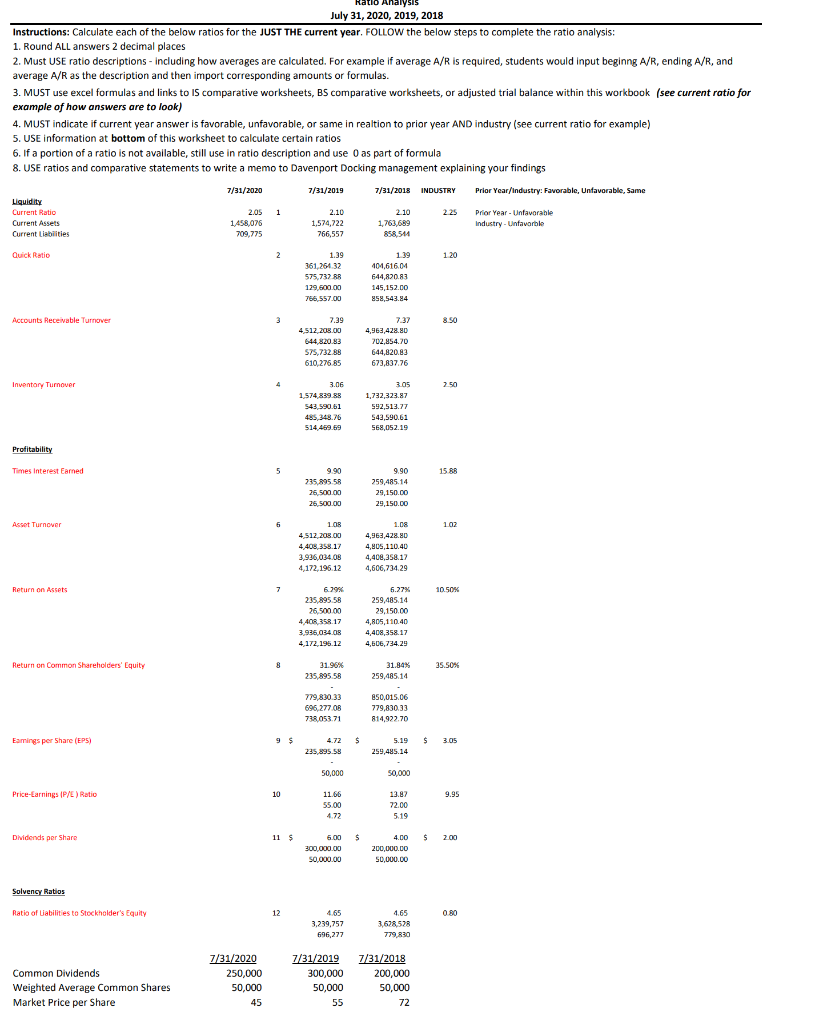
Part III - READ ALL INSTRUCTIONS - COMPLETELY SEPARATE FROM PARTS I & II Financial Statement Analysis a. Within this workbook there is a worksheet labeled "Adjusted Trial Balances". Within that worksheet you will find fully completed trial balances for 5 years. Also within this workbook you will find worksheets for comparative income statements and comparative balance sheets.Using the trial balances or comparative financial statements you need to calculate a variety of ratios. You will find the required ratios in the worksheet labeled "Ratios Historical". Complete all the required ratios AND analysis (see Ratios Historical worksheet). You MUST use formulas and/or linking to compute your ratios. You cannot simply hard key the answers. You must reference the appropriate data from the trial balances or comparative financial statements. b. After completing all of your ratio calcualtions, analyze the results in comparison to prior years and industry averages. Write a business memo explaining your findings. Your memo must be written in Word and follow normal business memo conventions - use word memo templates for this. There is not a length requirement, however you will be graded upon the substance of your analysis. July 31, 2020 Adjusted Trial Balance Dr July 31, 2019 Adjusted Trial Balance Dr CI July 31, 2018 Adjusted Trial Balance Dr July 31, 2017 Adjusted Trial Balance Di July 31, 2016 Adjusted Trial Balance Cr And Title Art No. 100 Cash $34.500 12439 44103145 432,21045 102 Accounts Receiva, 13.00 57572 15445 711219 6771 104 449,307.00 543.500/01 485.348.78 6.144.12 502.513.77 7.500.74 580.663.49 7,950.7 105 5,689.00 3,88141 16.632.00 18.627.84 2030435 107 120 Merchandise Inventory, net Office Supplies Prepaid Insurance Investments - Equity Trading Temporary) , Investments . HTM Long Term hans - Equity Long Term Valuation Allowance 15,400.00 120,000.00 145. 162.00 162.216.63 165.061 37 129.600.00 38.232.00 16,400.00 42,819.84 48.673.63 45,740.15 35,400.00 HOO 30 00 52000 960 105 411.12 121 122 123 140 103 01510000 07.1970 11718 Land 1,550,000.00 1,574,000.00 1.874,180.00 2,043,619 20 2.002.748.82 1,200,000.00 1,200,000.00 1451.520.00 1,582, 1540 1,550,519.5 750 000.00 810,000.00 99 8480 SETH 85,000.00 91.800.00 102 B16.00 112.068,44 109,820.0 68.000,00 73,440.00 82 250.00 89.655.55 B7862.44 14. 14,000 1512000 1640 14 1ANDO FAO 33 12,000.00 15.30614 12,900.00 795,458 40 14515 20 22371841 15.821 67 897 84781 830 680.00 819 0.6 10,000.00 10,800.00 120.00 19,184 84 12.92095 16.795.00 29.290.00 22.750.00 2426492 702,000.00 2274 756 240.00 786 1,872 400 630.000.00 1.DOC 839,801 57 857.001.60 171020 1679,73314 140400000 1941 132.4100 SKO On GT IST TIANE T2 IST 18,000.00 17.280.00 19,353.00 21.09642 20.673.52 145 Building 145 Acourt Depreciation - Building 151 Equipment Accumulated Depreciation Equipment 153 Office Furniture 151 Acuted Depreciation - Office Furniture 201 Accounts Payable 202 Wages Payable 203 Interest Payable 204 Dividends Payable 205 Linearned Rent 208 Customer Relinds Payable 250 Nolas Payable - Long Term 251 Band Payable 252 Premium an Ron Payable 253 Discount on Bonds Payable 252 Mortgage (Warchouse) Payable 300 Comerck. P. 10. Authorit 2.300 shares 301 Paid in Capital. Excess of Par, Common Stock 330 Retained Earning 331 Cash Dividence Try Stock 500 600 Cost of Goods Sold 700 Wage Expense hourly workers) 701 Salaries Expense Exempt Salt 702 Marketing Expense 703 Travel and Entertainment Expense 704 Dad Debt Expense 705 Property Tax Expense 708 Office Maintenance & Repair Expanse 7UT Accounting Expenses 705 Insurance Expense $24,000.00 396,530 20 387.628 42 900.000,00 50,000.00 50,000.00 301.00133 362 880.00 50.000.00 50 361.143.16 30.000.00 347,575.25 490.813.09 30.690.67 50.000.00 434.3750 204.604.17 324.502.75 388,667.17 329 202.03 200.000 0000000 200 m 200 000 200,000 9,0000 60.000.00 20,000.00 20.000.00 10.000.00 4256,800.00 4,512, 2000 4,512,200.00 4.2189144 1,485,00 1,574839.88 1.79233 1472 473 29 1425 3010S 760.157 64 756,894.00 500.000,00 302.307.64 348,000.00 B92.538.40 992.800.00 792.280.00 295,000.00 312.700.00 343.070.00 292,374.50 727,662.91 700.000 283.603 27 51.583.07 40,566 27 4808350 35,769.00 60.105.34 66.215 56.259 58 42,180.00 44.716.10 49,187.71 41.809.65 500,000.00 520,000.00 543 000.00 495 55000 20000 212000 2012 on 1920 1.96.73 10.000.00 10.600.00 11,500.00 9.911.00 9.613.67 12,000.00 12.720.00 13,092.00 11,298 29 11,538.40 76,31470 64 67 50 62.921.47 65,48000 546.00 60,377.00 578.76 541.14 524.91 5,425.00 5.790.50 6,325.55 5.215.42 5.376.72 29 73100 399,00 31000 34000 AO 1100 12:15 BI 17162 8.00.00 2,120.00 2,000.00 2.332.00 1,082 29 1,422.73 8,000.00 8,480.00 9328 DO 79180 70 5.500,00 G.451.05 6.267 02 710 Office Sussian perse Telecommunications Expense 712 Depreciation Expert - Building 713 Depreciation Expert - Faupment 714 Depreciation Expense - Office Furniture 800 Rent Income 001 Urrealized Gain - Tradin Securites 002 Realized Gain Investment Securities 900 Interest Fapanse 901 Unrealid Lone Train Sur 902 902 Resized Loss - Investment Securities Total Total Expenses and Rover Net Income Les 6.830.00 90,567.60 6.413.00 99.646.35 86,460.00 14.690.41 B2.158.42 25,000.00 39 150.00 4777 0 24,018 26.00 2.600.00 2.915.00 2.457 75 32.94 25 2.400.42 31,94623 38,785.18 2.500.00 33,230,00 8,523,608.00 8928,693.00 4,133,217.00 4255 780.00 2222.543.00 9,500,924.10 10 411 0109 10,238,96292 10.25 92 9.085.5.15 9,95 58.78 35,223.80 2.500.004.10 4 31210.02 235.895.58 4,617 1 0 10 471.010.79 1931.02 250.485.14 SHIR 4,068 48127 41614192 4.310 9397343 213.945.50 10.00) 10.00) (0.00) 10.000 10.00) Balance Sheet July 31, 2020, 2019, 2018, 2017, 2016 7/31/2019 7/31/2020 7/31/2018 7/31/2017 7/31/2016 ASSETS Current assets 334,504.00 404,616.04 441,031.48 432,210.85 361,264.32 575,732.88 702,854.70 688,797.61 533,086.00 449,397.00 644,820.83 543,590.61 592,513.77 485,348.76 6,144.12 5,689.00 Cash Accounts Receivable, net Merchandise Inventary, net Office Supplies Prepaid Insurance Investments. Equity Trading (Temporary) Total Current Assets Property, plant & equipment Land 15,400.00 120,000.00 580,663.49 7,350.73 19,898.26 155,051.32 6,881.41 18,627.84 145,152.00 16,632.00 129,600,00 7,500.74 20,304.35 158,215.68 1,458,076.00 1,574,722.08 1,763,688.73 1,922,420.72 1,883,972.30 1,550,000.00 1,674,000.00 1.874,800.00 2,043,619.20 2,002,746.82 1,200,000.00 1,451,520.00 (907,200.00) 1,550,513,66 1969,071.04) 102,816.00 Building Accumulated Depreciation - Building Equipment Accumulated Depreciation - Equipment Office Furniture Accumulated Depreciation - Office Furniture Total Property, plant & equipment Other Assets Investments - HTM Long Term Investments - Equity Long Term 1,295,000.00 (810,000.00) 91,800.00 173,440.00) ) 15,120.00 (12,950.00) 2,180,520.00 109.828.05 (87,862.44) 182,252.80) (750,000.00) 85,000.00 168,000.00) 14,000.00 (12,000.00) 2,019,000.00 1,582,156,80 (988,848.00) 112,069.44 (89,655.551 18,458.50 (15,821.571 2,661,978.82 16,934.40 (14,515.20) 2,442,182.40 18,089.33 (15,505.14) 2,608,739.24 38,232.00 42,819.84 46,673.63 35,400.00 80,000.00 52.000,00 45,740.15 103,367.5A 86,400.00 105,42712 Valuation Allowance 96,768.00 62,899.20 202,487.04 56,150.00 180,792.00 67,188.93 68,560.13 220,710 87 Total Other Assets Total Assets 167,400.00 3,644,476.00 216,296.66 4,709,008.20 3,936,034.08 4,408,358.17 4,805, 110.40 680.980.00 735,458.40 823,713.41 897,847.61 10,000.00 10,800.00 12,096.00 13,184.64 24,780.53 879,890.66 12,920.95 24,284.92 917,096.53 18,795.00 20,298.60 22,734,43 709,775.00 766,557,00 856,543.84 935,812.79 LIABILITIES & STOCKHOLDER'S EQUITY LIABILITIES Current Liabilities Accounts Payable Unearned Rent Customer Refunds Payable Total Current Liabilities Long-term Liabilities Notes Payable - Long Term Bonds Payable Premium on Bonds Payable Discount on Honds Payable Mortgage (Warehouse) Payable Total Long-term Liabilities Total Liabilities 785,240.00 650,000.00 1,300,000.00 1,572,480.00 857,001.60 1,714,003.20 73,833.98 56,000.00 (16,000.00) 300,000.00 702,000.00 1,404,000.00 60,480.00 (17,280.00) 324,000.00 2,473,200.00 67,737.60 (19,353.60) 362,880.00 839.861.57 1,679,723.14 72,357.30 (20,673.52) 387,628.42 ( (21,095.421 395,539.20 3,019,282.56 2.290,000.00 2,769,994.00 2.958,896.91 2,999,775.00 3,239,757.00 3,628,527.84 3,955,095.35 3,875,993.44 50,000.00 50,000.00 490,813.03 50,000.00 484,375.09 347,575.25 STOCKHOLDER'S EQUITY Common Stock, $1 Par, 100,000 Authorized; 50,000 Shares Issued/Outstanding Paid in Capital - Excess of Par, Common Stock Treasury Stock Cash Dividends Ending Retained Earnings Total Stockholder's Equity 50,000.00 361,143.16 (20,000,00) 50,000.00 381.694.33 (60,000.00) (300,000.00) (20,000.00 (10,000.00) 150,000.00) (250,000.00) 547,125.75 644,701.00 (200,000.00) 588,687.17 (200,000.00) 529,202.03 (200,000.00) 508,639.67 624,582.75 696,277.08 779,830.33 850,015.06 833,014.76 Total Liabilities and Stockholder's Equity 3,644,476.00 3,936,034.08 4,408,358.17 4,805, 110.41 4,709,008.19 TOTAL ASSETS TOTAL LIAB & EQUITY VARIANCE 3,644,476,00 3,644,476.00 3,936,034.08 3,936,034.08 0 4,408,358,17 4,408,358.17 0 4,805, 110.40 4,805, 110.41 0 4.709,008. 20 4,209,008.19 0 Ratio Analysis July 31, 2020, 2019, 2018 Instructions: Calculate each of the below ratios for the JUST THE current year. FOLLOW the below steps to complete the ratio analysis: 1. Round ALL answers 2 decimal places 2. Must USE ratio descriptions - including how averages are calculated. For example if average A/R is required, students would input beginng A/R, ending A/R, and average A/R as the description and then import corresponding amounts or formulas. 3. MUST use excel formulas and links to IS comparative worksheets, BS comparative worksheets, or adjusted trial balance within this workbook (see current ratio for example of how answers are to look) 4. MUST indicate if current year answer is favorable, unfavorable, or same in realtion to prior year AND industry (see current ratio for example) 5. USE information at bottom of this worksheet to calculate certain ratios 6. If a portion of a ratio is not available, still use in ratio description and use 0 as part of formula 8. USE ratios and comparative statements to write a memo to Davenport Docking management explaining your findings 7/31/2020 7/31/2019 7/31/2018 INDUSTRY Prior Year/Industry: Favorable, Unfavorable, Same 1 2.25 Liquidity Current Ratio Current Assets Current Liabilities 2.05 1,458,076 709,775 2.10 1,574,722 766,557 2.10 1,763,689 858,544 Prior Year. Unfavorable Industry - Unfavarble Quick Ratio 2 1.20 1.39 361,264 32 575,732 88 129,600.00 756 557.00 1.39 101.616.01 644,820.01 145,152.00 858,543.84 Accounts Receivable Turnover 7.39 4,512,200.00 644,820.83 575,732.88 610,276.85 7.37 4,963,428.80 702,854.70 644,820.83 673,837.76 Inventary Turnover 2.50 3.06 1,574 839.88 543,590.61 485,343.76 514 419.69 3.05 1,732,323.87 592,513.77 543,590.61 568,052.19 Profitability Times Interest Earned 5 15.88 9.90 235.895 58 26.500.00 26,500.00 9.90 259,485.14 29,150.00 29,150.00 Asset Turnover 1.02 1.08 4,512.208,00 4,408,358.17 3,936,034.08 4,172,196.12 1.08 4,963,428.80 4,805, 110.40 4,408,358.17 4,606 734.29 Return on Assets 7 10.50% 6.79% 235,895 58 26,500.00 4.408,358.17 3.936.034.0 4.172.196.12 6.27% 259,485.14 29,150.00 4,805, 110.40 4,408,358.17 4,606,734,29 Return on Common Shareholders' Equity 8 35.50% 31.98% 235,895.58 31.84% 259,485.14 779,830.33 696,27708 738 053.71 850,015.06 779,830.33 814,922.70 Eamings per Share (EPS) 9 $ $ $ 3.05 4.72 235,895.58 5.19 259,485.14 50,000 50,000 Price-Earnings (P/E) Ratio 10 9.95 1166 55.00 4.72 13.87 72.00 5.19 Dividends per Share 11 $ $ $ 2.00 6.00 300,000.00 50,000.00 4.00 200,000.00 50,000.00 Solvency Ratios Ratio of abilities to Stockholder's Equity 12 0.80 4.65 3,239,757 696,277 4.65 3,628,528 779,830 Common Dividends Weighted Average Common Shares Market Price per Share 7/31/2020 250,000 50,000 45 7/31/2019 300,000 50,000 55 7/31/2018 200,000 50,000 72 Part III - READ ALL INSTRUCTIONS - COMPLETELY SEPARATE FROM PARTS I & II Financial Statement Analysis a. Within this workbook there is a worksheet labeled "Adjusted Trial Balances". Within that worksheet you will find fully completed trial balances for 5 years. Also within this workbook you will find worksheets for comparative income statements and comparative balance sheets.Using the trial balances or comparative financial statements you need to calculate a variety of ratios. You will find the required ratios in the worksheet labeled "Ratios Historical". Complete all the required ratios AND analysis (see Ratios Historical worksheet). You MUST use formulas and/or linking to compute your ratios. You cannot simply hard key the answers. You must reference the appropriate data from the trial balances or comparative financial statements. b. After completing all of your ratio calcualtions, analyze the results in comparison to prior years and industry averages. Write a business memo explaining your findings. Your memo must be written in Word and follow normal business memo conventions - use word memo templates for this. There is not a length requirement, however you will be graded upon the substance of your analysis. July 31, 2020 Adjusted Trial Balance Dr July 31, 2019 Adjusted Trial Balance Dr CI July 31, 2018 Adjusted Trial Balance Dr July 31, 2017 Adjusted Trial Balance Di July 31, 2016 Adjusted Trial Balance Cr And Title Art No. 100 Cash $34.500 12439 44103145 432,21045 102 Accounts Receiva, 13.00 57572 15445 711219 6771 104 449,307.00 543.500/01 485.348.78 6.144.12 502.513.77 7.500.74 580.663.49 7,950.7 105 5,689.00 3,88141 16.632.00 18.627.84 2030435 107 120 Merchandise Inventory, net Office Supplies Prepaid Insurance Investments - Equity Trading Temporary) , Investments . HTM Long Term hans - Equity Long Term Valuation Allowance 15,400.00 120,000.00 145. 162.00 162.216.63 165.061 37 129.600.00 38.232.00 16,400.00 42,819.84 48.673.63 45,740.15 35,400.00 HOO 30 00 52000 960 105 411.12 121 122 123 140 103 01510000 07.1970 11718 Land 1,550,000.00 1,574,000.00 1.874,180.00 2,043,619 20 2.002.748.82 1,200,000.00 1,200,000.00 1451.520.00 1,582, 1540 1,550,519.5 750 000.00 810,000.00 99 8480 SETH 85,000.00 91.800.00 102 B16.00 112.068,44 109,820.0 68.000,00 73,440.00 82 250.00 89.655.55 B7862.44 14. 14,000 1512000 1640 14 1ANDO FAO 33 12,000.00 15.30614 12,900.00 795,458 40 14515 20 22371841 15.821 67 897 84781 830 680.00 819 0.6 10,000.00 10,800.00 120.00 19,184 84 12.92095 16.795.00 29.290.00 22.750.00 2426492 702,000.00 2274 756 240.00 786 1,872 400 630.000.00 1.DOC 839,801 57 857.001.60 171020 1679,73314 140400000 1941 132.4100 SKO On GT IST TIANE T2 IST 18,000.00 17.280.00 19,353.00 21.09642 20.673.52 145 Building 145 Acourt Depreciation - Building 151 Equipment Accumulated Depreciation Equipment 153 Office Furniture 151 Acuted Depreciation - Office Furniture 201 Accounts Payable 202 Wages Payable 203 Interest Payable 204 Dividends Payable 205 Linearned Rent 208 Customer Relinds Payable 250 Nolas Payable - Long Term 251 Band Payable 252 Premium an Ron Payable 253 Discount on Bonds Payable 252 Mortgage (Warchouse) Payable 300 Comerck. P. 10. Authorit 2.300 shares 301 Paid in Capital. Excess of Par, Common Stock 330 Retained Earning 331 Cash Dividence Try Stock 500 600 Cost of Goods Sold 700 Wage Expense hourly workers) 701 Salaries Expense Exempt Salt 702 Marketing Expense 703 Travel and Entertainment Expense 704 Dad Debt Expense 705 Property Tax Expense 708 Office Maintenance & Repair Expanse 7UT Accounting Expenses 705 Insurance Expense $24,000.00 396,530 20 387.628 42 900.000,00 50,000.00 50,000.00 301.00133 362 880.00 50.000.00 50 361.143.16 30.000.00 347,575.25 490.813.09 30.690.67 50.000.00 434.3750 204.604.17 324.502.75 388,667.17 329 202.03 200.000 0000000 200 m 200 000 200,000 9,0000 60.000.00 20,000.00 20.000.00 10.000.00 4256,800.00 4,512, 2000 4,512,200.00 4.2189144 1,485,00 1,574839.88 1.79233 1472 473 29 1425 3010S 760.157 64 756,894.00 500.000,00 302.307.64 348,000.00 B92.538.40 992.800.00 792.280.00 295,000.00 312.700.00 343.070.00 292,374.50 727,662.91 700.000 283.603 27 51.583.07 40,566 27 4808350 35,769.00 60.105.34 66.215 56.259 58 42,180.00 44.716.10 49,187.71 41.809.65 500,000.00 520,000.00 543 000.00 495 55000 20000 212000 2012 on 1920 1.96.73 10.000.00 10.600.00 11,500.00 9.911.00 9.613.67 12,000.00 12.720.00 13,092.00 11,298 29 11,538.40 76,31470 64 67 50 62.921.47 65,48000 546.00 60,377.00 578.76 541.14 524.91 5,425.00 5.790.50 6,325.55 5.215.42 5.376.72 29 73100 399,00 31000 34000 AO 1100 12:15 BI 17162 8.00.00 2,120.00 2,000.00 2.332.00 1,082 29 1,422.73 8,000.00 8,480.00 9328 DO 79180 70 5.500,00 G.451.05 6.267 02 710 Office Sussian perse Telecommunications Expense 712 Depreciation Expert - Building 713 Depreciation Expert - Faupment 714 Depreciation Expense - Office Furniture 800 Rent Income 001 Urrealized Gain - Tradin Securites 002 Realized Gain Investment Securities 900 Interest Fapanse 901 Unrealid Lone Train Sur 902 902 Resized Loss - Investment Securities Total Total Expenses and Rover Net Income Les 6.830.00 90,567.60 6.413.00 99.646.35 86,460.00 14.690.41 B2.158.42 25,000.00 39 150.00 4777 0 24,018 26.00 2.600.00 2.915.00 2.457 75 32.94 25 2.400.42 31,94623 38,785.18 2.500.00 33,230,00 8,523,608.00 8928,693.00 4,133,217.00 4255 780.00 2222.543.00 9,500,924.10 10 411 0109 10,238,96292 10.25 92 9.085.5.15 9,95 58.78 35,223.80 2.500.004.10 4 31210.02 235.895.58 4,617 1 0 10 471.010.79 1931.02 250.485.14 SHIR 4,068 48127 41614192 4.310 9397343 213.945.50 10.00) 10.00) (0.00) 10.000 10.00) Balance Sheet July 31, 2020, 2019, 2018, 2017, 2016 7/31/2019 7/31/2020 7/31/2018 7/31/2017 7/31/2016 ASSETS Current assets 334,504.00 404,616.04 441,031.48 432,210.85 361,264.32 575,732.88 702,854.70 688,797.61 533,086.00 449,397.00 644,820.83 543,590.61 592,513.77 485,348.76 6,144.12 5,689.00 Cash Accounts Receivable, net Merchandise Inventary, net Office Supplies Prepaid Insurance Investments. Equity Trading (Temporary) Total Current Assets Property, plant & equipment Land 15,400.00 120,000.00 580,663.49 7,350.73 19,898.26 155,051.32 6,881.41 18,627.84 145,152.00 16,632.00 129,600,00 7,500.74 20,304.35 158,215.68 1,458,076.00 1,574,722.08 1,763,688.73 1,922,420.72 1,883,972.30 1,550,000.00 1,674,000.00 1.874,800.00 2,043,619.20 2,002,746.82 1,200,000.00 1,451,520.00 (907,200.00) 1,550,513,66 1969,071.04) 102,816.00 Building Accumulated Depreciation - Building Equipment Accumulated Depreciation - Equipment Office Furniture Accumulated Depreciation - Office Furniture Total Property, plant & equipment Other Assets Investments - HTM Long Term Investments - Equity Long Term 1,295,000.00 (810,000.00) 91,800.00 173,440.00) ) 15,120.00 (12,950.00) 2,180,520.00 109.828.05 (87,862.44) 182,252.80) (750,000.00) 85,000.00 168,000.00) 14,000.00 (12,000.00) 2,019,000.00 1,582,156,80 (988,848.00) 112,069.44 (89,655.551 18,458.50 (15,821.571 2,661,978.82 16,934.40 (14,515.20) 2,442,182.40 18,089.33 (15,505.14) 2,608,739.24 38,232.00 42,819.84 46,673.63 35,400.00 80,000.00 52.000,00 45,740.15 103,367.5A 86,400.00 105,42712 Valuation Allowance 96,768.00 62,899.20 202,487.04 56,150.00 180,792.00 67,188.93 68,560.13 220,710 87 Total Other Assets Total Assets 167,400.00 3,644,476.00 216,296.66 4,709,008.20 3,936,034.08 4,408,358.17 4,805, 110.40 680.980.00 735,458.40 823,713.41 897,847.61 10,000.00 10,800.00 12,096.00 13,184.64 24,780.53 879,890.66 12,920.95 24,284.92 917,096.53 18,795.00 20,298.60 22,734,43 709,775.00 766,557,00 856,543.84 935,812.79 LIABILITIES & STOCKHOLDER'S EQUITY LIABILITIES Current Liabilities Accounts Payable Unearned Rent Customer Refunds Payable Total Current Liabilities Long-term Liabilities Notes Payable - Long Term Bonds Payable Premium on Bonds Payable Discount on Honds Payable Mortgage (Warehouse) Payable Total Long-term Liabilities Total Liabilities 785,240.00 650,000.00 1,300,000.00 1,572,480.00 857,001.60 1,714,003.20 73,833.98 56,000.00 (16,000.00) 300,000.00 702,000.00 1,404,000.00 60,480.00 (17,280.00) 324,000.00 2,473,200.00 67,737.60 (19,353.60) 362,880.00 839.861.57 1,679,723.14 72,357.30 (20,673.52) 387,628.42 ( (21,095.421 395,539.20 3,019,282.56 2.290,000.00 2,769,994.00 2.958,896.91 2,999,775.00 3,239,757.00 3,628,527.84 3,955,095.35 3,875,993.44 50,000.00 50,000.00 490,813.03 50,000.00 484,375.09 347,575.25 STOCKHOLDER'S EQUITY Common Stock, $1 Par, 100,000 Authorized; 50,000 Shares Issued/Outstanding Paid in Capital - Excess of Par, Common Stock Treasury Stock Cash Dividends Ending Retained Earnings Total Stockholder's Equity 50,000.00 361,143.16 (20,000,00) 50,000.00 381.694.33 (60,000.00) (300,000.00) (20,000.00 (10,000.00) 150,000.00) (250,000.00) 547,125.75 644,701.00 (200,000.00) 588,687.17 (200,000.00) 529,202.03 (200,000.00) 508,639.67 624,582.75 696,277.08 779,830.33 850,015.06 833,014.76 Total Liabilities and Stockholder's Equity 3,644,476.00 3,936,034.08 4,408,358.17 4,805, 110.41 4,709,008.19 TOTAL ASSETS TOTAL LIAB & EQUITY VARIANCE 3,644,476,00 3,644,476.00 3,936,034.08 3,936,034.08 0 4,408,358,17 4,408,358.17 0 4,805, 110.40 4,805, 110.41 0 4.709,008. 20 4,209,008.19 0 Ratio Analysis July 31, 2020, 2019, 2018 Instructions: Calculate each of the below ratios for the JUST THE current year. FOLLOW the below steps to complete the ratio analysis: 1. Round ALL answers 2 decimal places 2. Must USE ratio descriptions - including how averages are calculated. For example if average A/R is required, students would input beginng A/R, ending A/R, and average A/R as the description and then import corresponding amounts or formulas. 3. MUST use excel formulas and links to IS comparative worksheets, BS comparative worksheets, or adjusted trial balance within this workbook (see current ratio for example of how answers are to look) 4. MUST indicate if current year answer is favorable, unfavorable, or same in realtion to prior year AND industry (see current ratio for example) 5. USE information at bottom of this worksheet to calculate certain ratios 6. If a portion of a ratio is not available, still use in ratio description and use 0 as part of formula 8. USE ratios and comparative statements to write a memo to Davenport Docking management explaining your findings 7/31/2020 7/31/2019 7/31/2018 INDUSTRY Prior Year/Industry: Favorable, Unfavorable, Same 1 2.25 Liquidity Current Ratio Current Assets Current Liabilities 2.05 1,458,076 709,775 2.10 1,574,722 766,557 2.10 1,763,689 858,544 Prior Year. Unfavorable Industry - Unfavarble Quick Ratio 2 1.20 1.39 361,264 32 575,732 88 129,600.00 756 557.00 1.39 101.616.01 644,820.01 145,152.00 858,543.84 Accounts Receivable Turnover 7.39 4,512,200.00 644,820.83 575,732.88 610,276.85 7.37 4,963,428.80 702,854.70 644,820.83 673,837.76 Inventary Turnover 2.50 3.06 1,574 839.88 543,590.61 485,343.76 514 419.69 3.05 1,732,323.87 592,513.77 543,590.61 568,052.19 Profitability Times Interest Earned 5 15.88 9.90 235.895 58 26.500.00 26,500.00 9.90 259,485.14 29,150.00 29,150.00 Asset Turnover 1.02 1.08 4,512.208,00 4,408,358.17 3,936,034.08 4,172,196.12 1.08 4,963,428.80 4,805, 110.40 4,408,358.17 4,606 734.29 Return on Assets 7 10.50% 6.79% 235,895 58 26,500.00 4.408,358.17 3.936.034.0 4.172.196.12 6.27% 259,485.14 29,150.00 4,805, 110.40 4,408,358.17 4,606,734,29 Return on Common Shareholders' Equity 8 35.50% 31.98% 235,895.58 31.84% 259,485.14 779,830.33 696,27708 738 053.71 850,015.06 779,830.33 814,922.70 Eamings per Share (EPS) 9 $ $ $ 3.05 4.72 235,895.58 5.19 259,485.14 50,000 50,000 Price-Earnings (P/E) Ratio 10 9.95 1166 55.00 4.72 13.87 72.00 5.19 Dividends per Share 11 $ $ $ 2.00 6.00 300,000.00 50,000.00 4.00 200,000.00 50,000.00 Solvency Ratios Ratio of abilities to Stockholder's Equity 12 0.80 4.65 3,239,757 696,277 4.65 3,628,528 779,830 Common Dividends Weighted Average Common Shares Market Price per Share 7/31/2020 250,000 50,000 45 7/31/2019 300,000 50,000 55 7/31/2018 200,000 50,000 72