Answered step by step
Verified Expert Solution
Question
1 Approved Answer
I don't understand how to create jennings chart or where to start 1 ) Create a Levey - Jennings chart for the Level I control
I don't understand how to create jennings chart or where to start
Create a LeveyJennings chart for the Level I control reported for Laboratory A in Self Test using a mean of and a standard deviation of Assuma that each data point was obtained on separate days. Are there any points outside the s limits
Create a LeveyJennings chart for the Level II control reported for Laboratory A in Sell Test H using a mean of and a standard deviation of Assume that each data point was obtained on separate days. Are there ary points outside the s limits
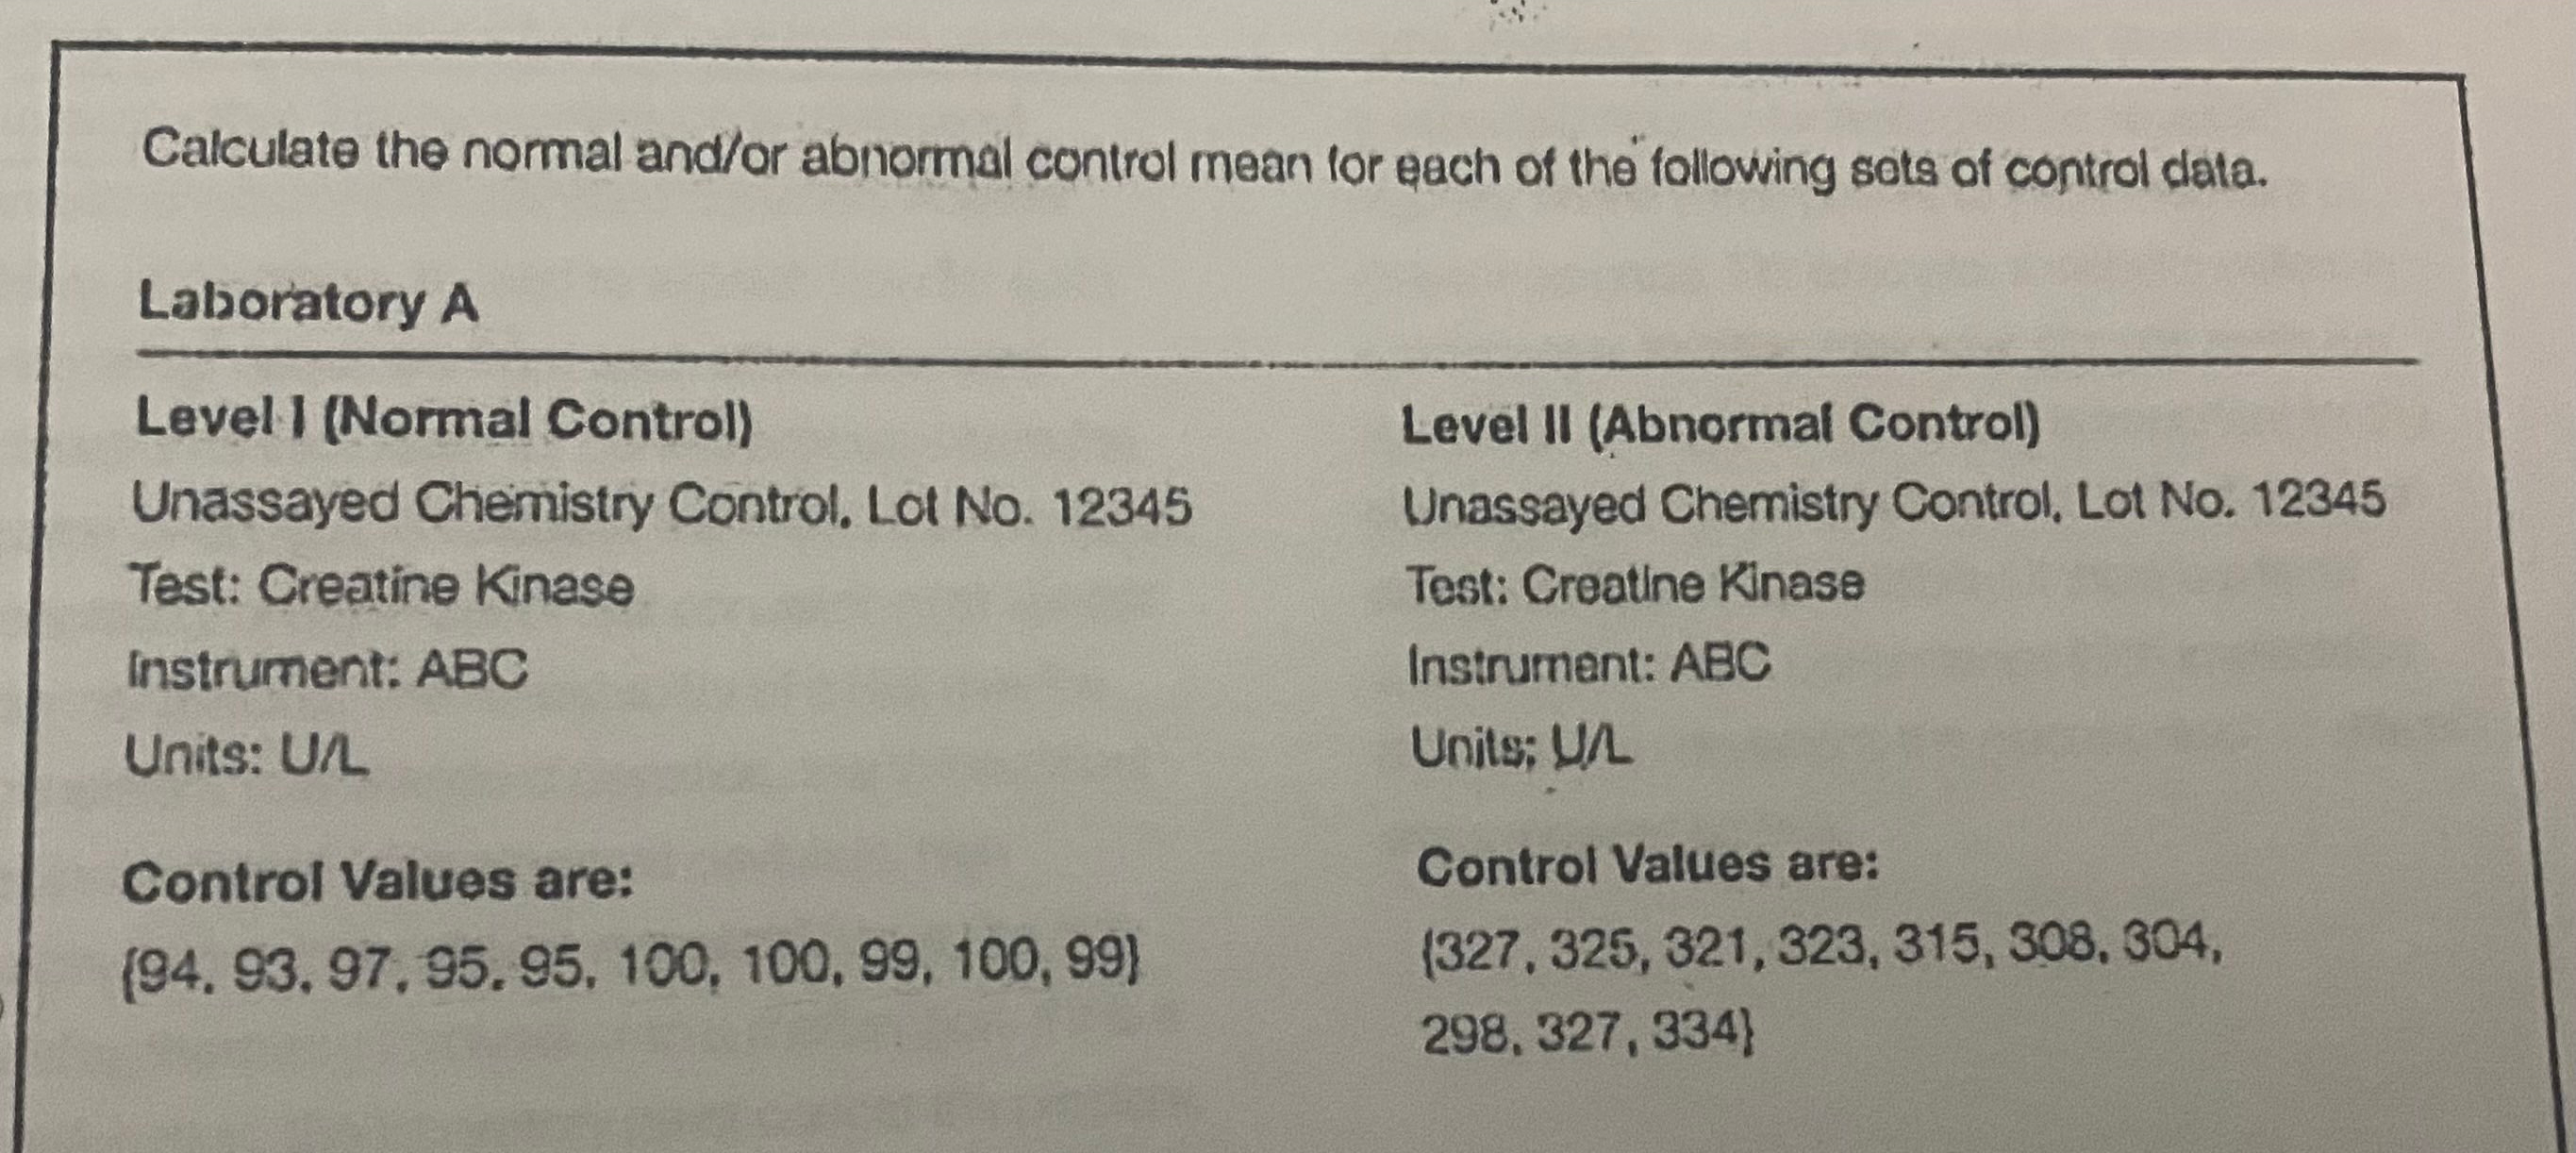
Calculate the normal andor abnormal control mean for each of the following sets of control data.
Laboratory A
Level I Normal Control
Level II Abnormal Control
Unassayed Chemistry Control. Lol No
Unassayed Chemistry Control. Lol No
Test: Creatine Kinase
Test: Creatine Kinase
instrument: ABC
Instrument: ABC
Units: UR
Units: UR
Control Values are:
Control Values are:

Step by Step Solution
There are 3 Steps involved in it
Step: 1

Get Instant Access to Expert-Tailored Solutions
See step-by-step solutions with expert insights and AI powered tools for academic success
Step: 2

Step: 3

Ace Your Homework with AI
Get the answers you need in no time with our AI-driven, step-by-step assistance
Get Started


