Answered step by step
Verified Expert Solution
Link Copied!

Question

1 Approved Answer

i dont understand the calculations for this lab. if some one could help give a step by step that would be awesome. ive attached the

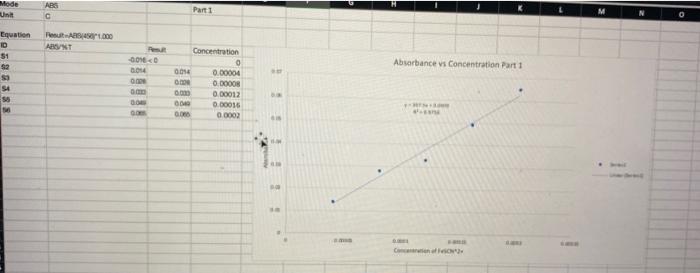
i dont understand the calculations for this lab. if some one could help give a step by step that would be awesome. ive attached the lab results for part one and part two. ive done the excel graph, but not 100% sure its right. image text in transcribed
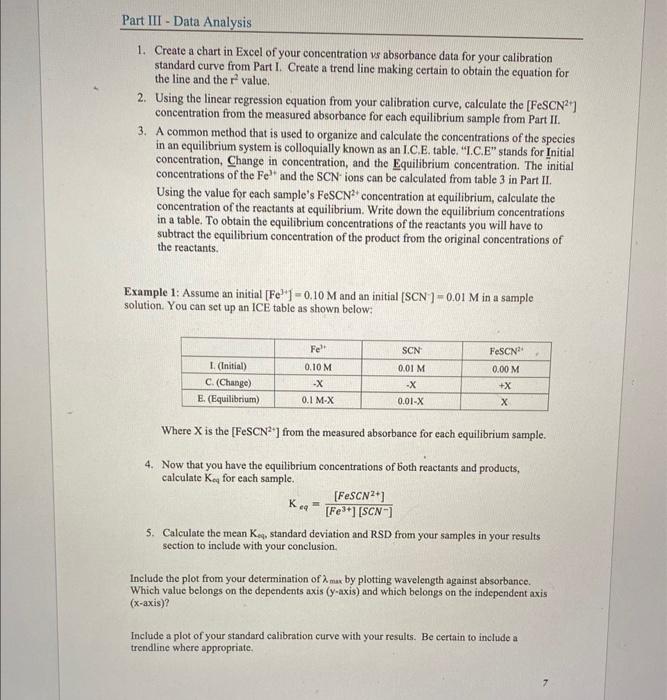
image text in transcribed
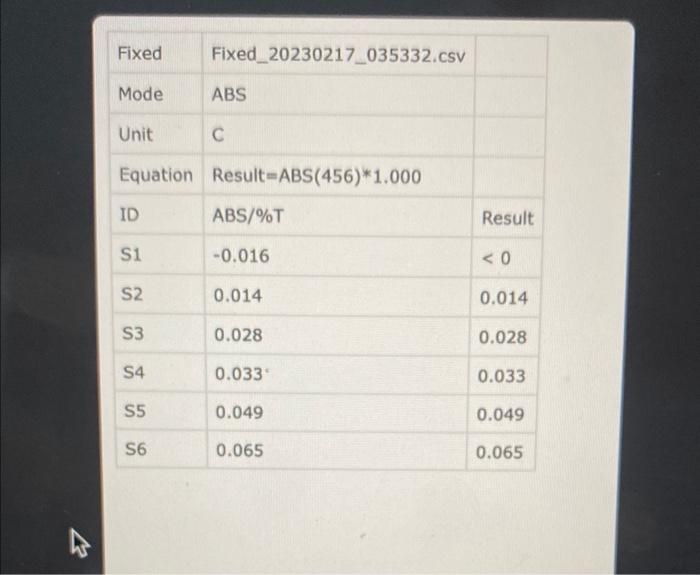
this is part 1
image text in transcribed
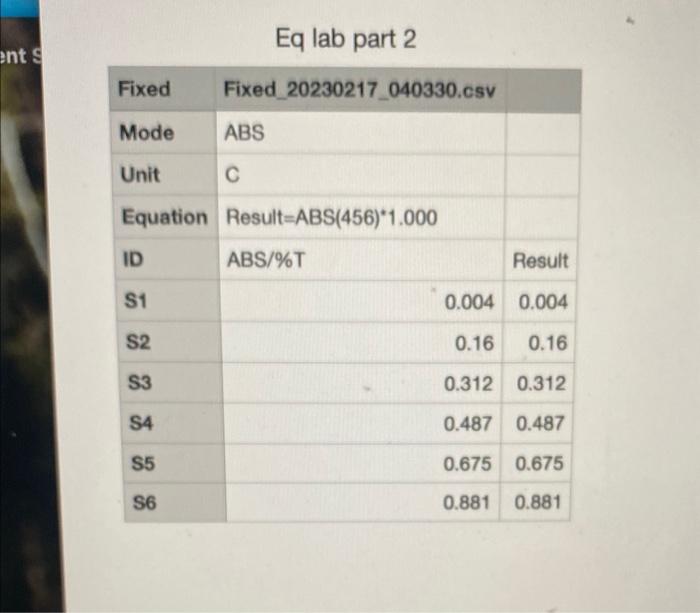
this is part 2
image text in transcribed
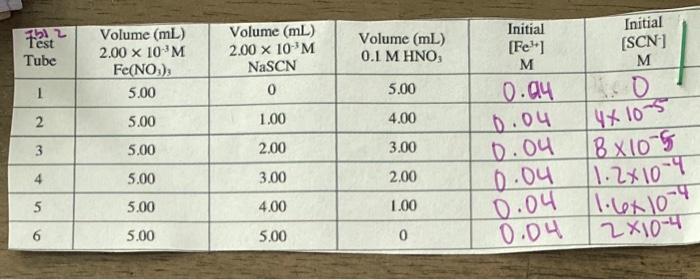
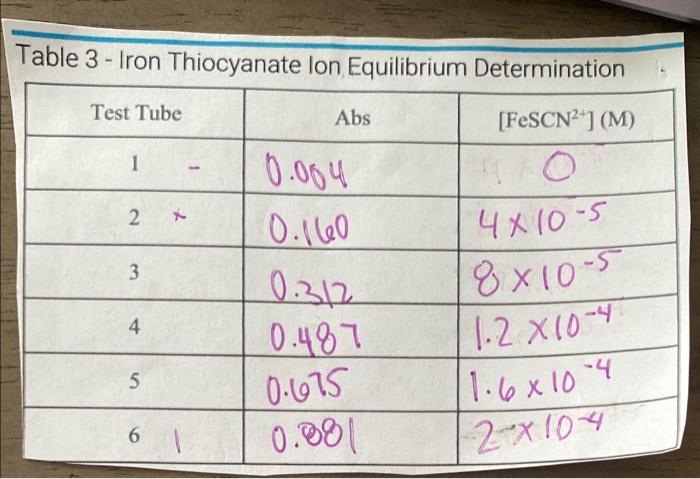
here are more tables, i am so lost im not sure how to use this information image text in transcribed
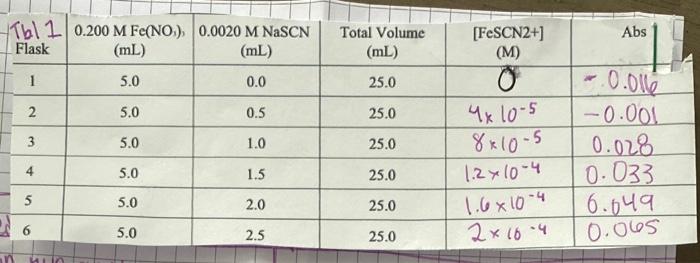
image text in transcribed
1. Create a chart in Excel of your concentration vs absorbance data for your calibration standard curve from Part I. Create a trend line making certain to obtain the equation for the line and the r2 value. concentration from the measured absorbance for each equilibrium sample from Part II. 3. A common method that is used to organize and calculate the concentrations of the species in an equilibrium system is colloquially known as an I.C.E. table. "I.C.E" stands for Initial concentration, Change in concentration, and the Equilibrium concentration. The initial concentrations of the Fe and the SCN ions can be calculated from table 3 in Part II. Using the value for each sample's FeSCN2+ concentration at equilibrium, calculate the concentration of the reactants at equilibrium. Write down the equilibrium concentrations in a table. To obtain the equilibrium concentrations of the reactants you will have to subtract the equilibrium concentration of the product from the original concentrations of the reactants. Example 1: Assume an initial [FeH]=0.10M and an initial [SCN]=0.01M in a sample solution. You can set up an ICE table as shown below: Where X is the [FeSCN2+ ] from the measured absorbance for each equilibrium sample. 4. Now that you have the equilibrium concentrations of both reactants and products, calculate Keq for each sample. Keq=[Fe3+][SCN][FeSCN2+] section to include with your conclusion. Include the plot from your determination of max by plotting wavelength against absorbance. Which value belongs on the dependents axis ( y-axis) and which belongs on the independent axis (x-axis)? Include a plot of your standard calibration curve with your results. Be certain to include a trendline where appropriate. \begin{tabular}{|l|l|l|} \hline Fixed & Fixed_20230217_035332.csv & \\ \hline Mode & ABS & \\ \hline Unit & C & \\ \hline Equation & Result=ABS(456)*1.000 & \\ \hline ID & ABS/\%T & Result \\ \hline S1 & 0.016 &

Step by Step Solution

There are 3 Steps involved in it

Step: 1

blur-text-image

Get Instant Access to Expert-Tailored Solutions

See step-by-step solutions with expert insights and AI powered tools for academic success

Step: 2

blur-text-image

Step: 3

blur-text-image

Ace Your Homework with AI

Get the answers you need in no time with our AI-driven, step-by-step assistance

Get Started

Recommended Textbook for

Physical Chemistry

Authors: Peter Atkins

7th Edition

978-0716735397, 716735393, 978-0716743880

More Books

Students also viewed these Chemistry questions

Question

What actions do you need to take now to get there?

Answered: 1 week ago

Question

Where do you want your school to be at this time next year?

Answered: 1 week ago