Question: I have 2 case studies and one HW I need the answers with the steps please, I'm trying to past the possible image of the
I have 2 case studies and one HW I need the answers with the steps please, I'm trying to past the possible image of the questions, to whom view the questions can you please zoom to see the questions .I waited a lot .
case study 1 there are 3 parts each part consists of 4 questions that I need to type the answer
case study 2 there is just one question to answer i need to type the answer
HW consist of one question its a multiple choice
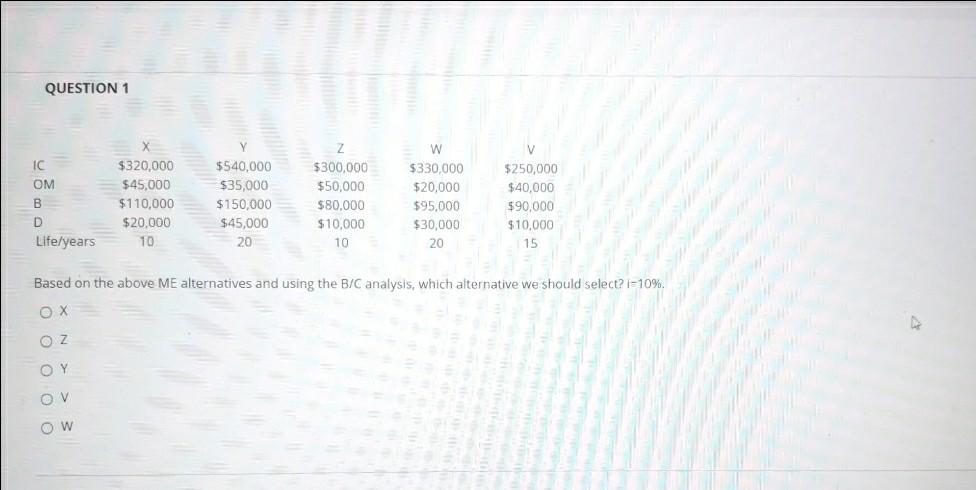
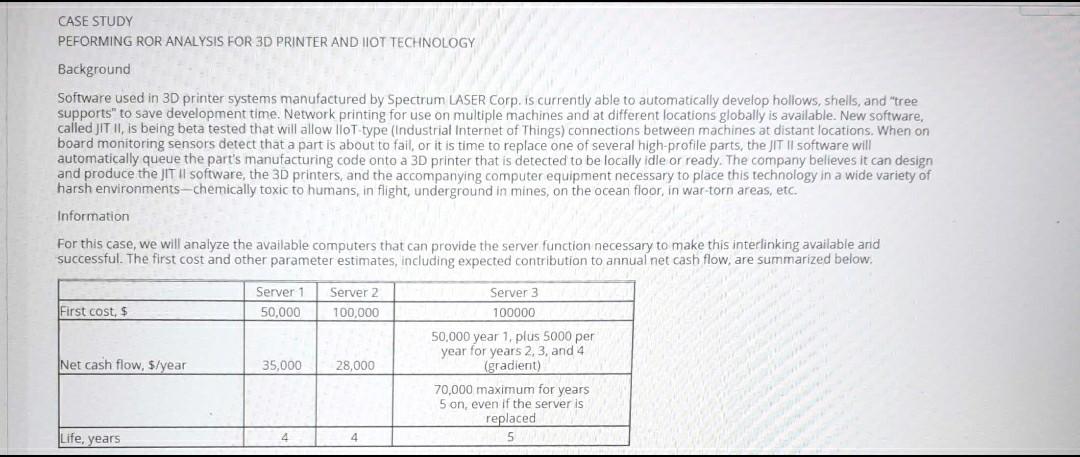
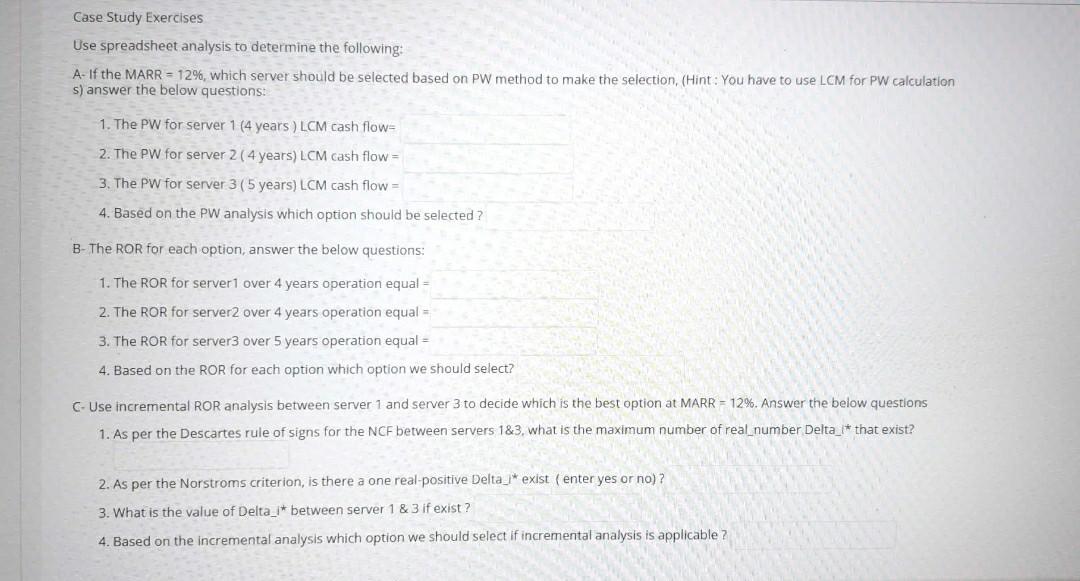
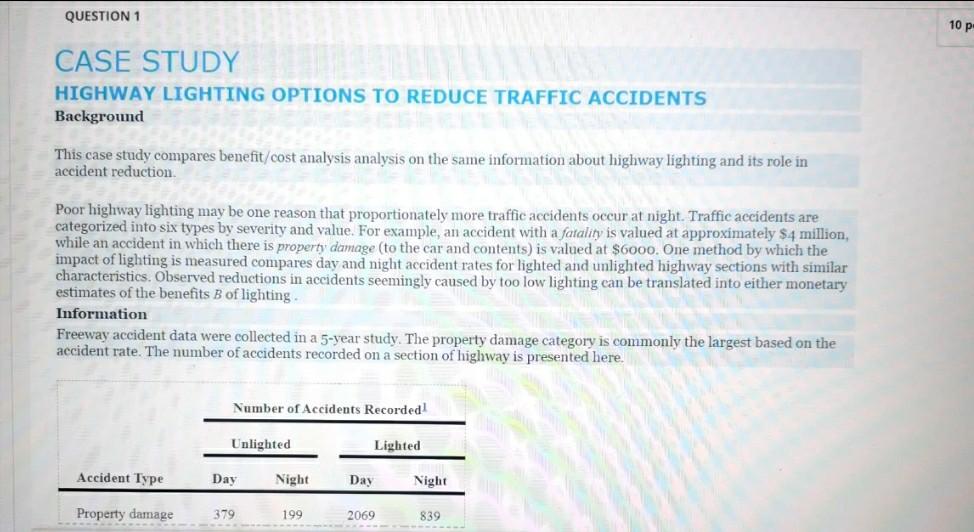
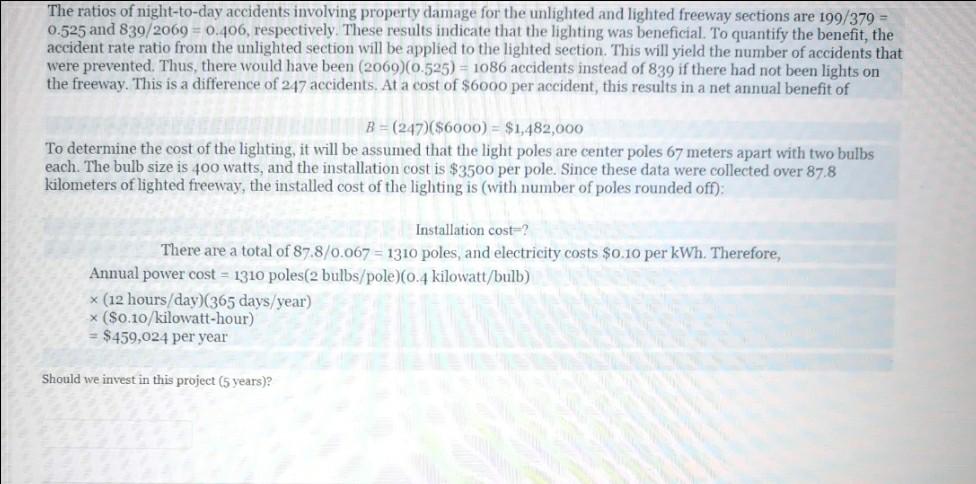
CASE STUDY PEFORMING ROR ANALYSIS FOR 3D PRINTER AND IOT TECHNOLOGY Background Software used in 3D printer systems manufactured by Spectrum LASER Corp. is currently able to automatically develop hollows, shells, and "tree supports" to save development time. Network printing for use on multiple machines and at different locations globally is available. New software, called JITI, is being beta tested that will allow lloT-type (Industrial Internet of Things) connections between machines at distant locations. When on board monitoring sensors detect that a part is about to fail, or it is time to replace one of several high-profile parts, the JIT Il software will automatically queue the part's manufacturing code onto a 3D printer that is detected to be locally idle or ready. The company believes it can design and produce the JIT il software, the 3D printers, and the accompanying computer equipment necessary to place this technology in a wide variety of harsh environments-chemically toxic to humans, in flight, underground in mines, on the ocean floor, in war-torn areas, etc. Information For this case, we will analyze the available computers that can provide the server function necessary to make this interlinking available and successful. The first cost and other parameter estimates, including expected contribution to annual net cash flow, are summarized below. Server 1 50,000 Server 2 100,000 First cost, $ Net cash flow, $/year 35,000 28,000 Server 3 100000 50,000 year 1, plus 5000 per year for years 2, 3, and 4 (gradient) 70,000 maximum for years 5 on, even if the server is replaced 5 Life, years 4 Case Study Exercises Use spreadsheet analysis to determine the following: A- If the MARR = 12%, which server should be selected based on PW method to make the selection, (Hint: You have to use LCM for PW calculation s) answer the below questions: 1. The PW for server 1 (4 years ) LCM cash flow- 2. The PW for server 2( 4 years) LCM cash flow = 3. The PW for server 3 (5 years) LCM cash flow = 4. Based on the PW analysis which option should be selected ? B- The ROR for each option, answer the below questions: 1. The ROR for server 1 over 4 years operation equal - 2. The ROR for server2 over 4 years operation equal = 3. The ROR for server over 5 years operation equal = 4. Based on the ROR for each option which option we should select? C-Use incremental ROR analysis between server 1 and server 3 to decide which is the best option at MARR - 12%. Answer the below questions 1. As per the Descartes rule of signs for the NCF between servers 1&3, what is the maximum number of real number Delta_l* that exist? 2. As per the Norstroms criterion, is there a one real-positive Delta_1* exist (enter yes or no)? 3. What is the value of Delta_l* between server 1 & 3 if exist? 4. Based on the incremental analysis which option we should select if incremental analysis is applicable ? QUESTION 1 10 p. CASE STUDY HIGHWAY LIGHTING OPTIONS TO REDUCE TRAFFIC ACCIDENTS Background This case study compares benefit/cost analysis analysis on the same information about highway lighting and its role in accident reduction Poor highway lighting may be one reason that proportionately more traffic accidents occur at night. Traffic accidents are categorized into six types by severity and value. For example, an accident with a fatality is valued at approximately $4 million, while an accident in which there is property damage (to the car and contents) is valued at $6000. One method by which the impact of lighting is measured compares day and night accident rates for lighted and unlighted highway sections with similar characteristics. Observed reductions in accidents seemingly caused by too low lighting can be translated into either monetary estimates of the benefits B of lighting Information Freeway accident data were collected in a 5-year study. The property damage category is commonly the largest based on the accident rate. The number of accidents recorded on a section of highway is presented here. Number of Accidents Recorded Unlighted Lighted Accident Type Day Night Day Night Property damage 379 199 2069 839 The ratios of night-to-day accidents involving property damage for the unlighted and lighted freeway sections are 199/379 = 0.525 and 839/2069 = 0.406, respectively. These results indicate that the lighting was beneficial. To quantify the benefit, the accident rate ratio from the unlighted section will be applied to the lighted section. This will yield the number of accidents that were prevented. Thus, there would have been (2069)(0.525) = 1086 accidents instead of 839 if there had not been lights on the freeway. This is a difference of 247 accidents. At a cost of $6000 per accident, this results in a net annual benefit of B = (247)($6000) = $1,482,000 To determine the cost of the lighting, it will be assumed that the light poles are center poles 67 meters apart with two bulbs each. The bulb size is 400 watts, and the installation cost is $3500 per pole. Since these data were collected over 87.8 kilometers of lighted freeway, the installed cost of the lighting is (with number of poles rounded off): Installation cost? There are a total of 87.8/0.067 = 1310 poles, and electricity costs $0.10 per kWh. Therefore, Annual power cost = 1310 poles(2 bulbs/pole)(0.4 kilowatt/bulb) x (12 hours/day)(365 days/year) x ($0.10/kilowatt-hour) $459,024 per year Should we invest in this project (5 years)? QUESTION 1 IC OM B D Life/years $320,000 $45,000 $110,000 $20,000 10 $540,000 $35,000 $150,000 $45,000 20 $300,000 $50,000 $80,000 $10,000 10 w $330,000 $20,000 $95,000 $30,000 20 V $250,000 $40,000 $90,000 $10,000 15 Based on the above ME alternatives and using the B/C analysis, which alternative we should select?i=10%. OZ OY OV OW CASE STUDY PEFORMING ROR ANALYSIS FOR 3D PRINTER AND IOT TECHNOLOGY Background Software used in 3D printer systems manufactured by Spectrum LASER Corp. is currently able to automatically develop hollows, shells, and "tree supports" to save development time. Network printing for use on multiple machines and at different locations globally is available. New software, called JITI, is being beta tested that will allow lloT-type (Industrial Internet of Things) connections between machines at distant locations. When on board monitoring sensors detect that a part is about to fail, or it is time to replace one of several high-profile parts, the JIT Il software will automatically queue the part's manufacturing code onto a 3D printer that is detected to be locally idle or ready. The company believes it can design and produce the JIT il software, the 3D printers, and the accompanying computer equipment necessary to place this technology in a wide variety of harsh environments-chemically toxic to humans, in flight, underground in mines, on the ocean floor, in war-torn areas, etc. Information For this case, we will analyze the available computers that can provide the server function necessary to make this interlinking available and successful. The first cost and other parameter estimates, including expected contribution to annual net cash flow, are summarized below. Server 1 50,000 Server 2 100,000 First cost, $ Net cash flow, $/year 35,000 28,000 Server 3 100000 50,000 year 1, plus 5000 per year for years 2, 3, and 4 (gradient) 70,000 maximum for years 5 on, even if the server is replaced 5 Life, years 4 Case Study Exercises Use spreadsheet analysis to determine the following: A- If the MARR = 12%, which server should be selected based on PW method to make the selection, (Hint: You have to use LCM for PW calculation s) answer the below questions: 1. The PW for server 1 (4 years ) LCM cash flow- 2. The PW for server 2( 4 years) LCM cash flow = 3. The PW for server 3 (5 years) LCM cash flow = 4. Based on the PW analysis which option should be selected ? B- The ROR for each option, answer the below questions: 1. The ROR for server 1 over 4 years operation equal - 2. The ROR for server2 over 4 years operation equal = 3. The ROR for server over 5 years operation equal = 4. Based on the ROR for each option which option we should select? C-Use incremental ROR analysis between server 1 and server 3 to decide which is the best option at MARR - 12%. Answer the below questions 1. As per the Descartes rule of signs for the NCF between servers 1&3, what is the maximum number of real number Delta_l* that exist? 2. As per the Norstroms criterion, is there a one real-positive Delta_1* exist (enter yes or no)? 3. What is the value of Delta_l* between server 1 & 3 if exist? 4. Based on the incremental analysis which option we should select if incremental analysis is applicable ? QUESTION 1 10 p. CASE STUDY HIGHWAY LIGHTING OPTIONS TO REDUCE TRAFFIC ACCIDENTS Background This case study compares benefit/cost analysis analysis on the same information about highway lighting and its role in accident reduction Poor highway lighting may be one reason that proportionately more traffic accidents occur at night. Traffic accidents are categorized into six types by severity and value. For example, an accident with a fatality is valued at approximately $4 million, while an accident in which there is property damage (to the car and contents) is valued at $6000. One method by which the impact of lighting is measured compares day and night accident rates for lighted and unlighted highway sections with similar characteristics. Observed reductions in accidents seemingly caused by too low lighting can be translated into either monetary estimates of the benefits B of lighting Information Freeway accident data were collected in a 5-year study. The property damage category is commonly the largest based on the accident rate. The number of accidents recorded on a section of highway is presented here. Number of Accidents Recorded Unlighted Lighted Accident Type Day Night Day Night Property damage 379 199 2069 839 The ratios of night-to-day accidents involving property damage for the unlighted and lighted freeway sections are 199/379 = 0.525 and 839/2069 = 0.406, respectively. These results indicate that the lighting was beneficial. To quantify the benefit, the accident rate ratio from the unlighted section will be applied to the lighted section. This will yield the number of accidents that were prevented. Thus, there would have been (2069)(0.525) = 1086 accidents instead of 839 if there had not been lights on the freeway. This is a difference of 247 accidents. At a cost of $6000 per accident, this results in a net annual benefit of B = (247)($6000) = $1,482,000 To determine the cost of the lighting, it will be assumed that the light poles are center poles 67 meters apart with two bulbs each. The bulb size is 400 watts, and the installation cost is $3500 per pole. Since these data were collected over 87.8 kilometers of lighted freeway, the installed cost of the lighting is (with number of poles rounded off): Installation cost? There are a total of 87.8/0.067 = 1310 poles, and electricity costs $0.10 per kWh. Therefore, Annual power cost = 1310 poles(2 bulbs/pole)(0.4 kilowatt/bulb) x (12 hours/day)(365 days/year) x ($0.10/kilowatt-hour) $459,024 per year Should we invest in this project (5 years)? QUESTION 1 IC OM B D Life/years $320,000 $45,000 $110,000 $20,000 10 $540,000 $35,000 $150,000 $45,000 20 $300,000 $50,000 $80,000 $10,000 10 w $330,000 $20,000 $95,000 $30,000 20 V $250,000 $40,000 $90,000 $10,000 15 Based on the above ME alternatives and using the B/C analysis, which alternative we should select?i=10%. OZ OY OV OW
Step by Step Solution
There are 3 Steps involved in it

Get step-by-step solutions from verified subject matter experts


