Question
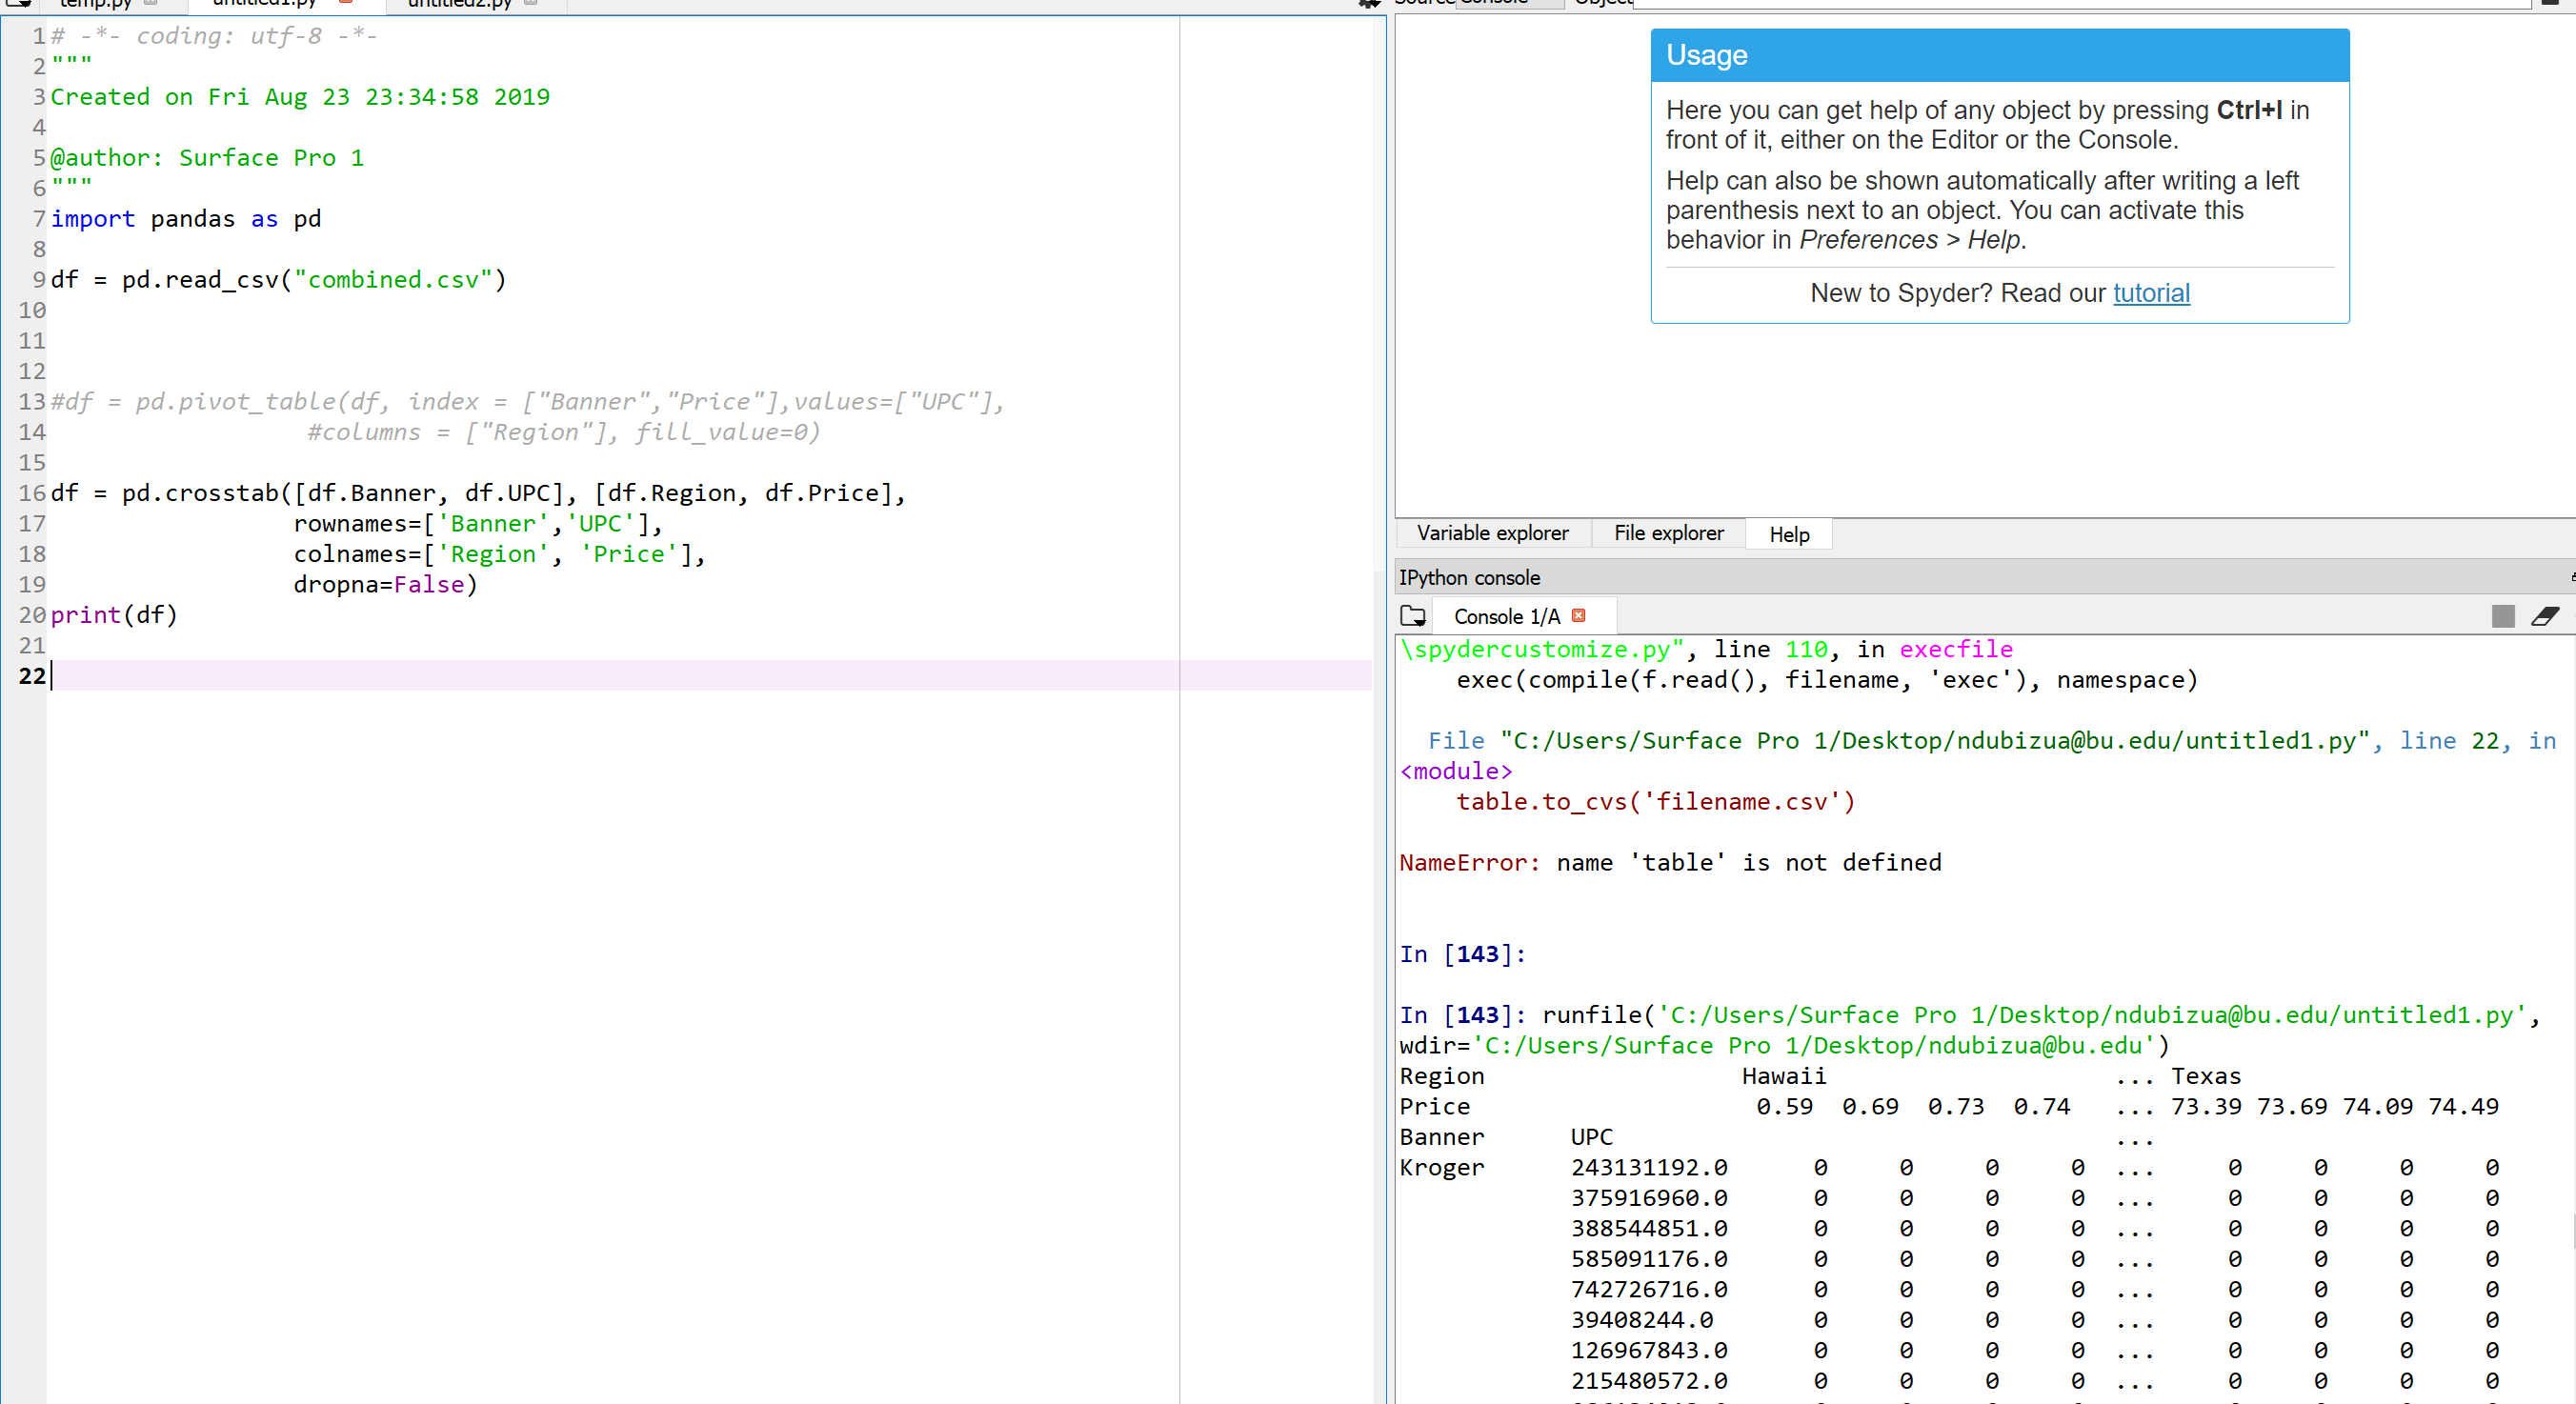
I have 3 files. price.csv, auditors.csv, and stores.json i converted the json files into a csv file. prices.csv describes prices collected for products, represented as
I have 3 files. price.csv, auditors.csv, and stores.json i converted the json files into a csv file. prices.csv describes prices collected for products, represented as UPC, at speci?c physical store locations, represented as Store ID.auditors files has who collected prices at each store are represented as Auditor ID. Store attribute information is described in stores.json, and auditor information is shown in auditors.csv i need help creating a cross tabulation in python that shows the price for each product broken down by banner. it should look like this: here is also my code so far:


Step by Step Solution
There are 3 Steps involved in it
Step: 1

Get Instant Access to Expert-Tailored Solutions
See step-by-step solutions with expert insights and AI powered tools for academic success
Step: 2

Step: 3

Ace Your Homework with AI
Get the answers you need in no time with our AI-driven, step-by-step assistance
Get Started


