I have a few stats problems that I NEED guidance one. I have given the data table and ordered each question.
5.
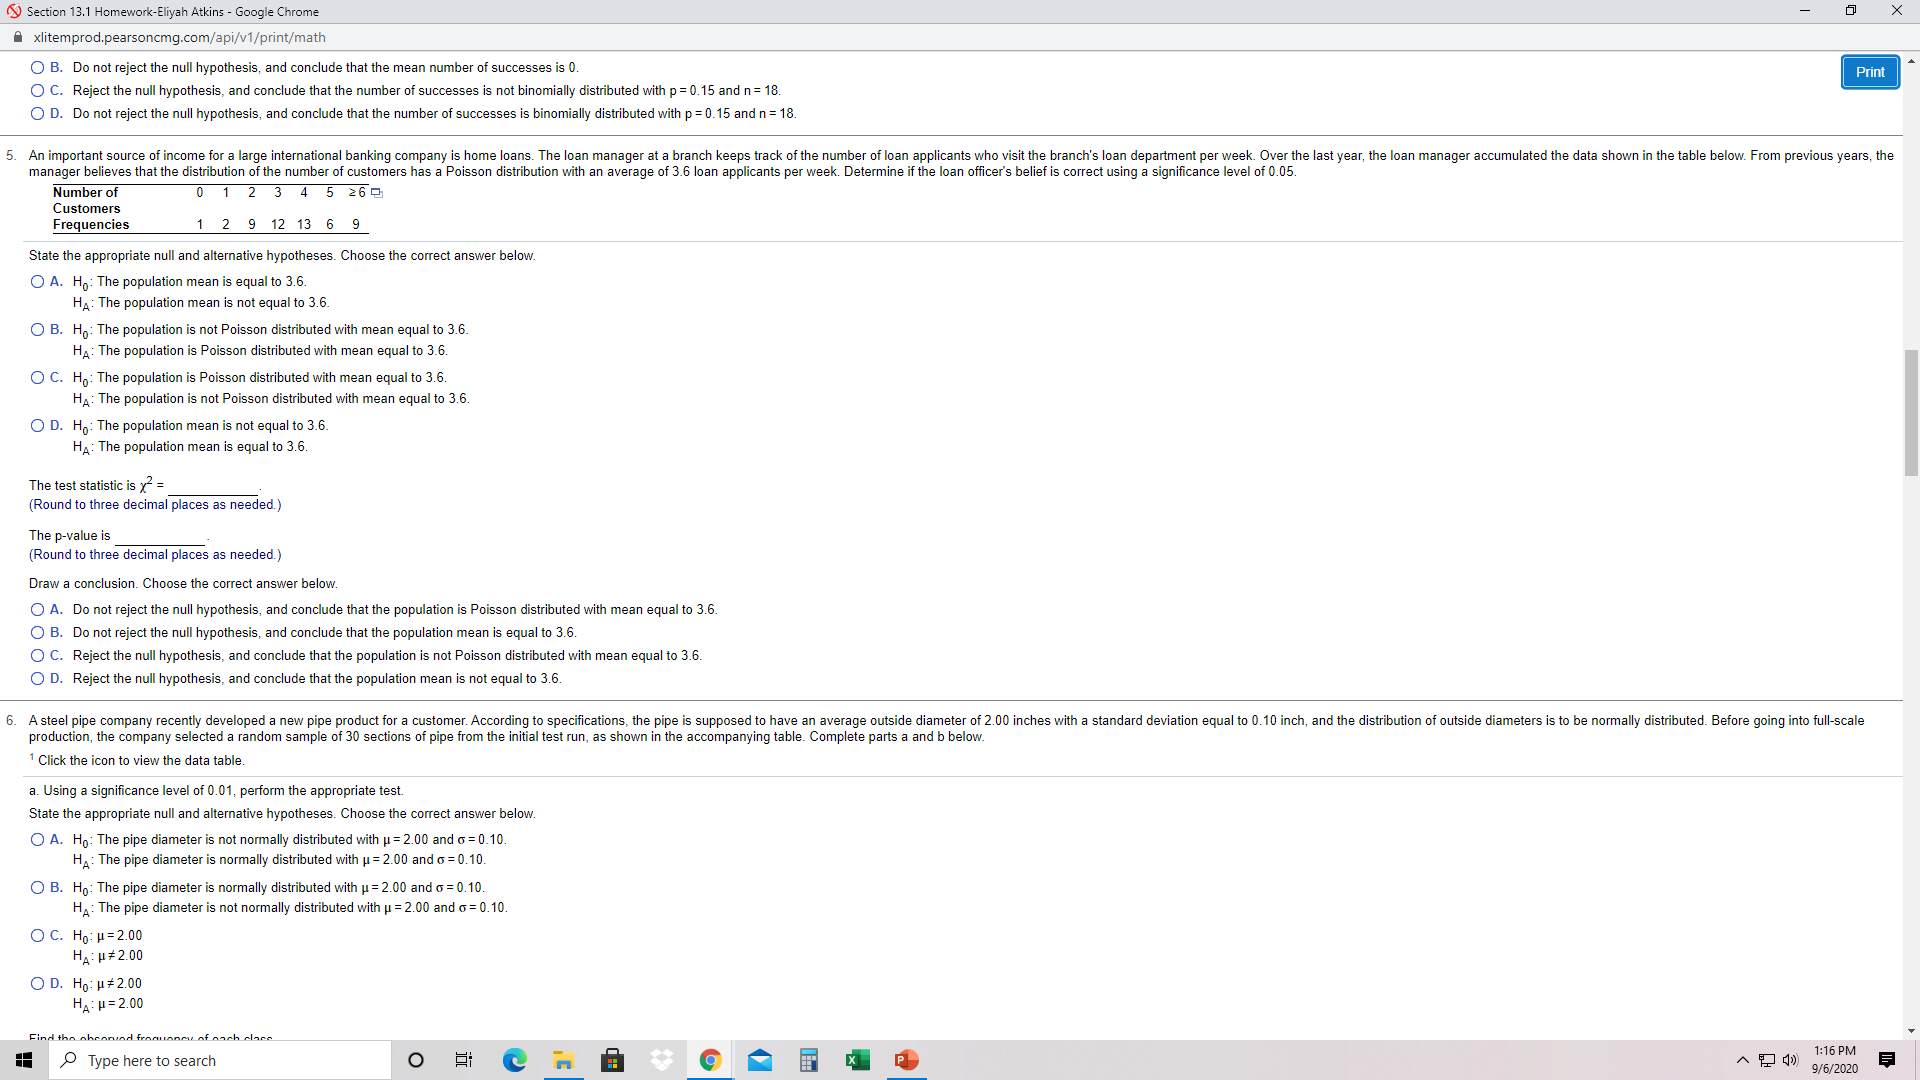
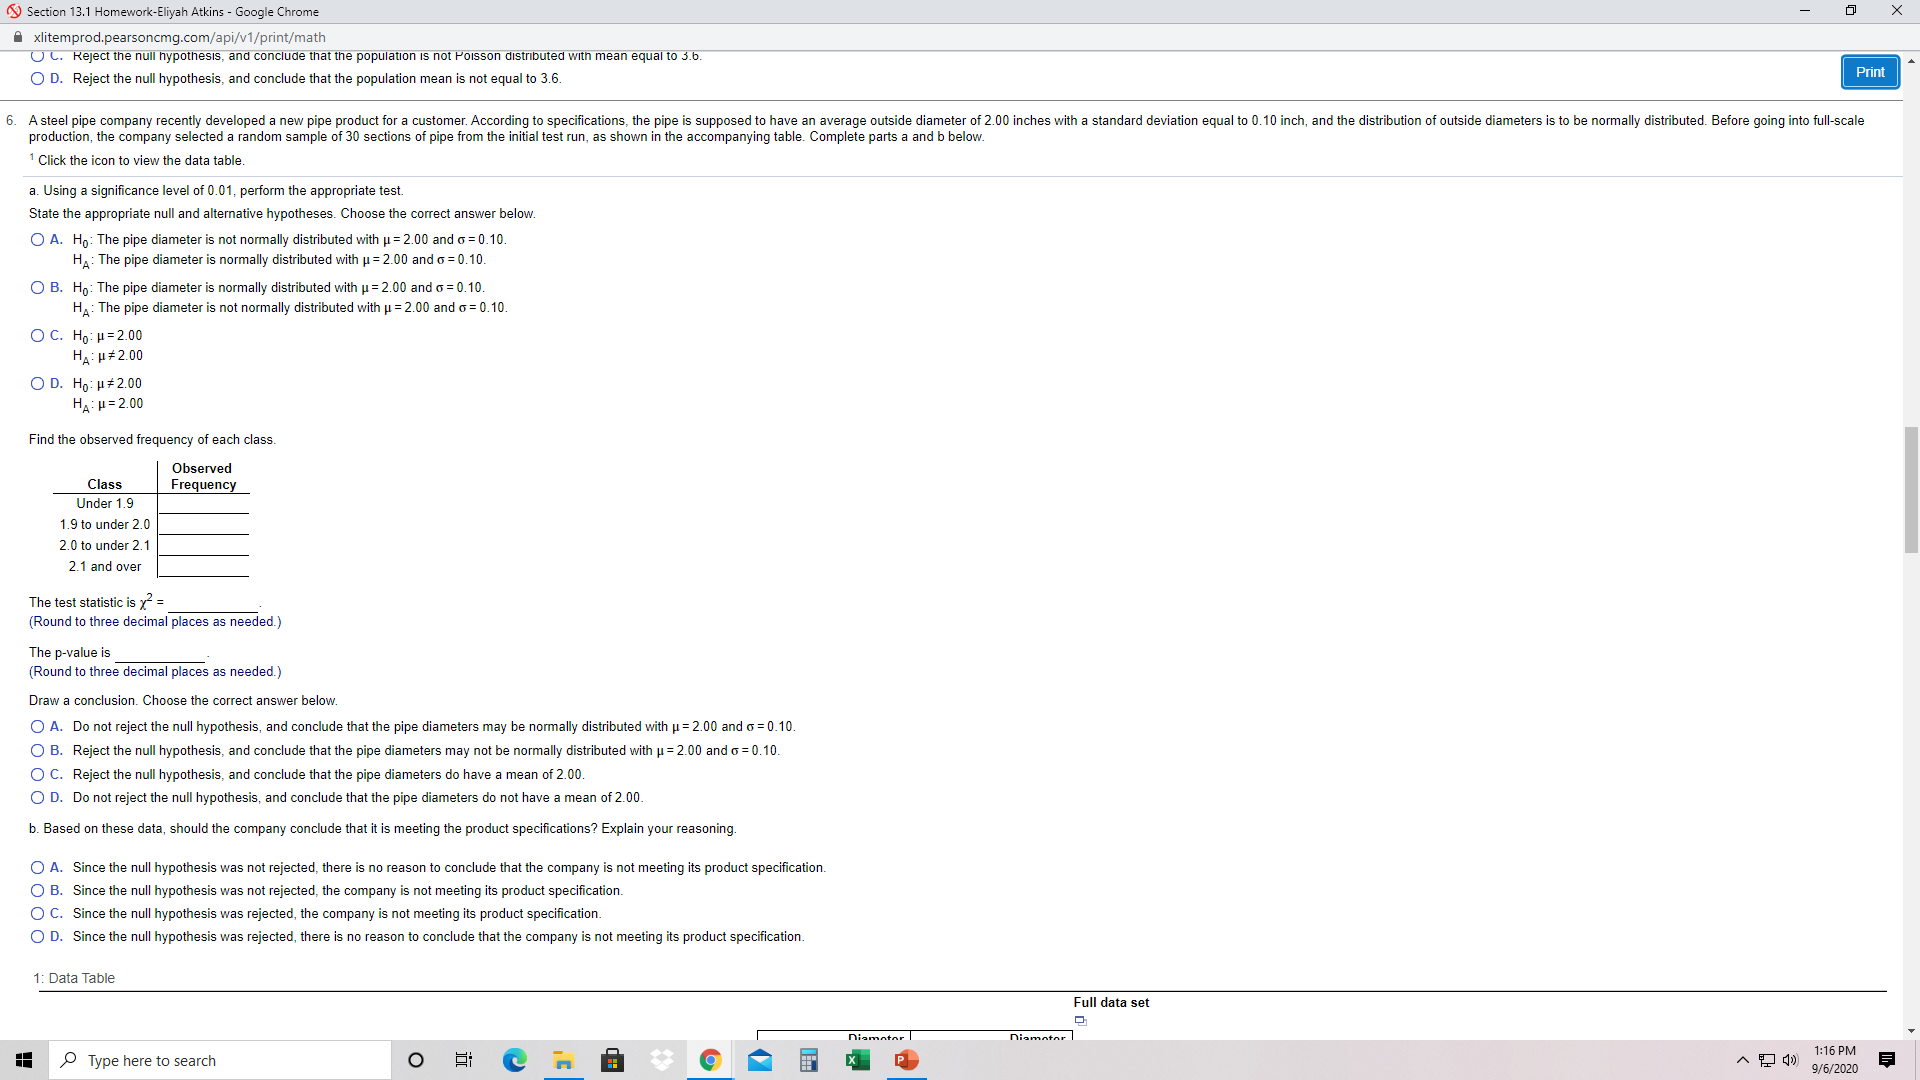
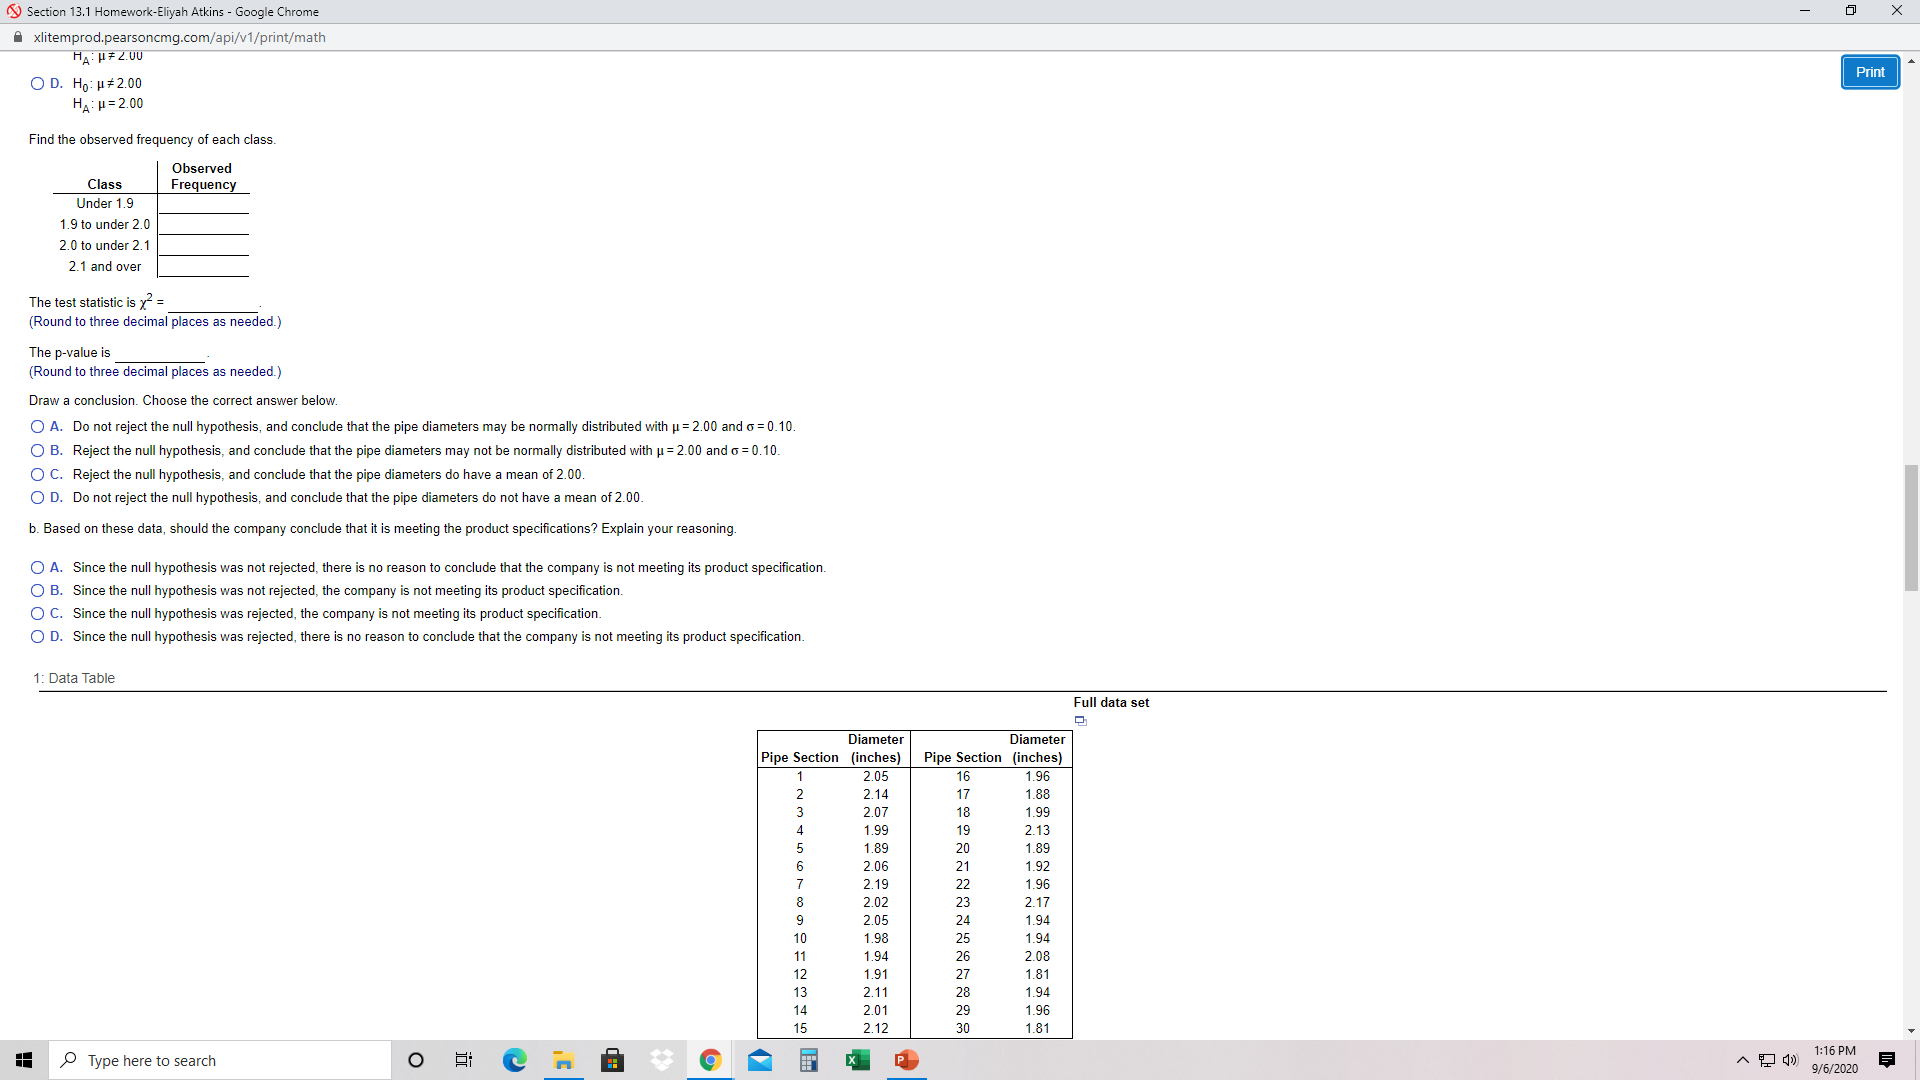
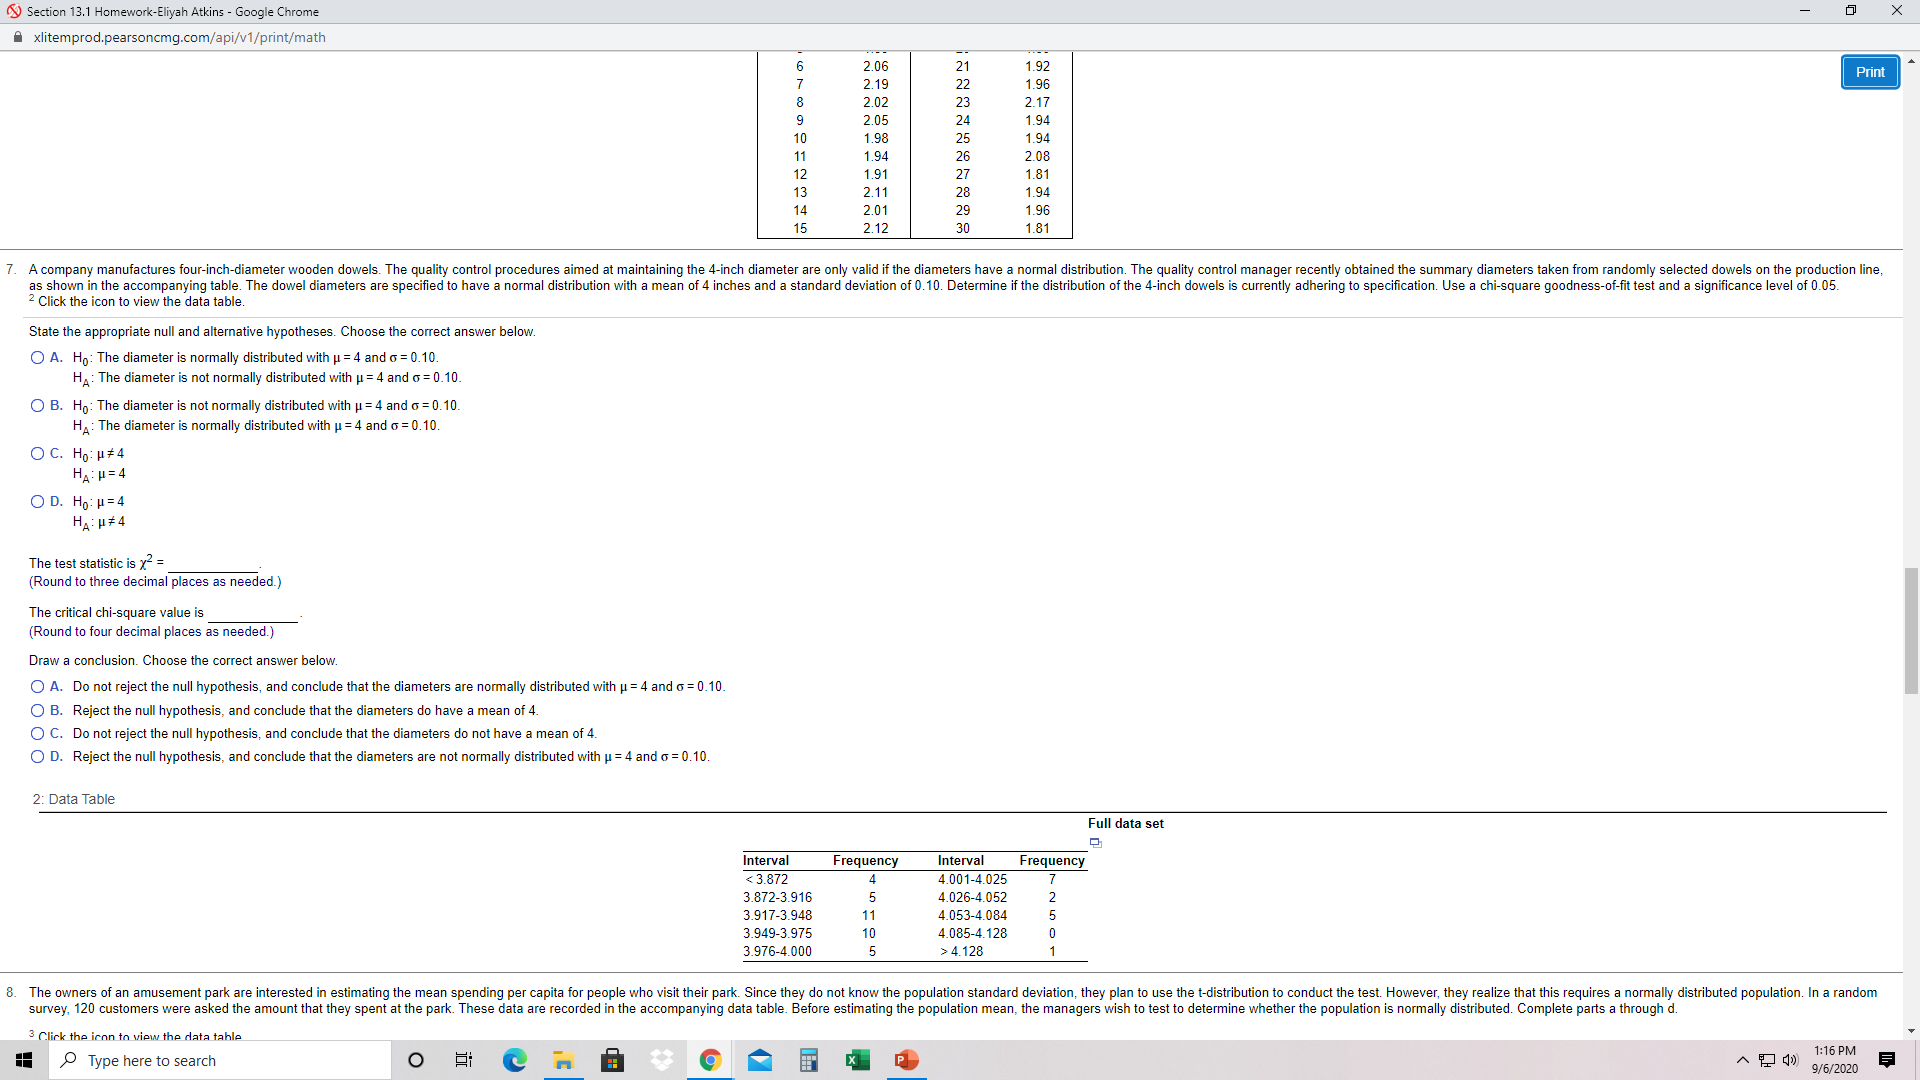
Section 13.1 Homework-Eliyah Atkins - Google Chrome X Axlitemprod.pearsoncmg.com/api/v1/print/math O B. Do not reject the null hypothesis, and conclude that the mean number of successes is 0 Print O C. Reject the null hypothesis, and conclude that the number of successes is not binomially distributed with p = 0.15 and n = 18. O D. Do not reject the null hypothesis, and conclude that the number of successes is binomially distributed with p = 0.15 and n = 18. 5. An important source of income for a large international banking company is home loans. The loan manager at a branch keeps track of the number of loan applicants who visit the branch's loan department per week. Over the last year, the loan manager accumulated the data shown in the table below. From previous years, the manager believes that the distribution of the number of customers has a Poisson distribution with an average of 3.6 loan applicants per week. Determine if the loan officer's belief is correct using a significance level of 0.05. Number of Customers 5 26 5 Frequencies 2 9 12 13 6 9 State the appropriate null and alternative hypotheses. Choose the correct answer below. O A. Ho: The population mean is equal to 3.6 HA: The population mean is not equal to 3.6. O B. Ho: The population is not Poisson distributed with mean equal to 3.6. HA: The population is Poisson distributed with mean equal to 3.6. O C. Ho: The population is Poisson distributed with mean equal to 3.6. HA: The population is not Poisson distributed with mean equal to 3.6. O D. Ho: The population mean is not equal to 3.6. HA: The population mean is equal to 3.6. The test statistic is x = (Round to three decimal places as needed.) The p-value is (Round to three decimal places as needed.) Draw a conclusion. Choose the correct answer below. O A. Do not reject the null hypothesis, and conclude that the population is Poisson distributed with mean equal to 3.6. O B. Do not reject the null hypothesis, and conclude that the population mean is equal to 3.6. O C. Reject the null hypothesis, and conclude that the population is not Poisson distributed with mean equal to 3.6. O D. Reject the null hypothesis, and conclude that the population mean is not equal to 3.6. 6. A steel pipe company recently developed a new pipe product for a customer. According to specifications, the pipe is supposed to have an average outside diameter of 2.00 inches with a standard deviation equal to 0.10 inch, and the distribution of outside diameters is to be normally distributed. Before going into full-scale production, the company selected a random sample of 30 sections of pipe from the initial test run, as shown in the accompanying table. Complete parts a and b below. Click the icon to view the data table. a. Using a significance level of 0.01, perform the appropriate test. State the appropriate null and alternative hypotheses. Choose the correct answer below. O A. Ho: The pipe diameter is not normally distributed with u = 2.00 and o = 0.10 HA : The pipe diameter is normally distributed with u = 2.00 and o = 0.10. O B. Ho: The pipe diameter is normally distributed with u = 2.00 and o = 0. 10. HA: The pipe diameter is not normally distributed with u = 2.00 and o = 0. 10. O C. Ho: H = 2.00 HA : H# 2.00 O D. Ho: H # 2.00 HA : H= 2.00 Find the shearund fronuance of nach clare Type here to search O 1:16 PM 9/6/2020Section 13.1 Homework-Eliyah Atkins - Google Chrome X xlitemprod.pearsoncmg.com/api/v1/print/math U C. Reject the null hypothesis, and conclude that the population is not Poisson distributed with mean equal to 3.6. O D. Reject the null hypothesis, and conclude that the population mean is not equal to 3.6 Print 6. A steel pipe company recently developed a new pipe product for a customer. According to specifications, the pipe is supposed to have an average outside diameter of 2.00 inches with a standard deviation equal to 0.10 inch, and the distribution of outside diameters is to be normally distributed. Before going into full-scale production, the company selected a random sample of 30 sections of pipe from the initial test run, as shown in the accompanying table. Complete parts a and b below. Click the icon to view the data table. a. Using a significance level of 0.01, perform the appropriate test. State the appropriate null and alternative hypotheses. Choose the correct answer below. O A. Ho: The pipe diameter is not normally distributed with u = 2.00 and o = 0.10. HA: The pipe diameter is normally distributed with u = 2.00 and o = 0.10. O B. Ho: The pipe diameter is normally distributed with u = 2.00 and q = 0.10. HA: The pipe diameter is not normally distributed with u = 2.00 and o = 0. 10. O C. Ho: H= 2.00 HA : H# 2.00 O D. Ho: H #2.00 HA : H = 2.00 Find the observed frequency of each class. Observed Class Frequency Under 1.9 1.9 to under 2.0 2.0 to under 2.1 2.1 and over The test statistic is x = (Round to three decimal places as needed.) The p-value is (Round to three decimal places as needed.) Draw a conclusion. Choose the correct answer below. O A. Do not reject the null hypothesis, and conclude that the pipe diameters may be normally distributed with u = 2.00 and q = 0.10. O B. Reject the null hypothesis, and conclude that the pipe diameters may not be normally distributed with u = 2.00 and o = 0.10. O C. Reject the null hypothesis, and conclude that the pipe diameters do have a mean of 2.00. O D. Do not reject the null hypothesis, and conclude that the pipe diameters do not have a mean of 2.00. b. Based on these data, should the company conclude that it is meeting the product specifications? Explain your reasoning O A. Since the null hypothesis was not rejected, there is no reason to conclude that the company is not meeting its product specification. O B. Since the null hypothesis was not rejected, the company is not meeting its product specification. O C. Since the null hypothesis was rejected, the company is not meeting its product specification. O D. Since the null hypothesis was rejected, there is no reason to conclude that the company is not meeting its product specification. 1: Data Table Full data set niamatar Diamator Type here to search O X P 1:16 PM 9/6/2020Section 13.1 Homework-Eliyah Atkins - Google Chrome X xlitemprod.pearsoncmg.com/api/v1/print/math HA : H = 2.00 O D. Ho: H # 2.00 Print HA : H= 2.00 Find the observed frequency of each class. Observed Class Frequency Under 1.9 1.9 to under 2.0 2.0 to under 2.1 2.1 and over The test statistic is x- = (Round to three decimal places as needed.) The p-value is (Round to three decimal places as needed.) Draw a conclusion. Choose the correct answer below. O A. Do not reject the null hypothesis, and conclude that the pipe diameters may be normally distributed with u = 2.00 and o = 0.10. O B. Reject the null hypothesis, and conclude that the pipe diameters may not be normally distributed with u = 2.00 and o = 0.10. O C. Reject the null hypothesis, and conclude that the pipe diameters do have a mean of 2.00. O D. Do not reject the null hypothesis, and conclude that the pipe diameters do not have a mean of 2.00. b. Based on these data, should the company conclude that it is meeting the product specifications? Explain your reasoning O A. Since the null hypothesis was not rejected, there is no reason to conclude that the company is not meeting its product specification. O B. Since the null hypothesis was not rejected, the company is not meeting its product specification O C. Since the null hypothesis was rejected, the company is not meeting its product specification. O D. Since the null hypothesis was rejected, there is no reason to conclude that the company is not meeting its product specification. 1: Data Table Full data set Diameter Diameter Pipe Section (inches) Pipe Section (inches) NEWNISOONOUAWN 2.05 1.96 2.14 1 1.88 2.07 18 1.99 1.99 19 2.13 1.89 20 1.89 2.06 21 1.92 2.19 1.96 2.02 2.17 2.05 1.94 1.98 1.94 1.94 2.08 1.91 1.81 2.1 1.94 2.0' 1.96 2.12 1.81 Type here to search O X P 1:16 PM 9/6/2020Section 13.1 Homework-Eliyah Atkins - Google Chrome X xlitemprod.pearsoncmg.com/api/v1/print/math 1.92 1.96 Print 2.17 2.05 1.94 1.94 2.08 1.81 2.1 1.94 2.01 1.96 2.12 1.81 A company manufactures four-inch-diameter wooden dowels. The quality control procedures aimed at maintaining the 4-inch diameter are only valid if the diameters have a normal distribution. The quality control manager recently obtained the summary diameters taken from randomly selected dowels on the production line, Is shown in the accompanying table. The dowel diameters are specified to have a normal distribution with a mean of 4 inches and a standard deviation of 0.10. Determine if the distribution of the 4-inch dowels is currently adhering to specification. Use a chi-square goodness-of-fit test and a significance level of 0.05 Click the icon to view the data table. State the appropriate null and alternative hypotheses. Choose the correct answer below. O A. Ho: The diameter is normally distributed with u = 4 and o = 0.10. HA: The diameter is not normally distributed with u = 4 and o = 0.10. O B. Ho: The diameter is not normally distributed with u = 4 and o = 0.10. HA: The diameter is normally distributed with u = 4 and o = 0.10. O C. Ho: H#4 HA : H= 4 OD. Ho: H = 4 HA : H# 4 The test statistic is x = (Round to three decimal places as needed.) The critical chi-square value is (Round to four decimal places as needed.) Draw a conclusion. Choose the correct answer below. O A. Do not reject the null hypothesis, and conclude that the diameters are normally distributed with u = 4 and o = 0.10. O B. Reject the null hypothesis, and conclude that the diameters do have a mean of 4. O C. Do not reject the null hypothesis, and conclude that the diameters do not have a mean of 4. O D. Reject the null hypothesis, and conclude that the diameters are not normally distributed with u = 4 and o = 0.10. 2: Data Table Full data set Interva Frequency Interval Frequency 4.128 -OUN 8. The owners of an amusement park are interested in estimating the mean spending per capita for people who visit their park. Since they do not know the population standard deviation, they plan to use the t-distribution to conduct the test. However, they realize that this requires a normally distributed population. In a random survey, 120 customers were asked the amount that they spent at the park. These data are recorded in the accompanying data table. Before estimating the population mean, the managers wish to test to determine whether the population is normally distributed. Complete parts a through d. Click the icon to view the data table Type here to search O X 1:16 PM 9/6/2020


