Question
*I have a lot of this done (will paste below) but I need help debugging, very bad at MATLAB 1) Read a comma-separated-values text file
*I have a lot of this done (will paste below) but I need help debugging, very bad at MATLAB
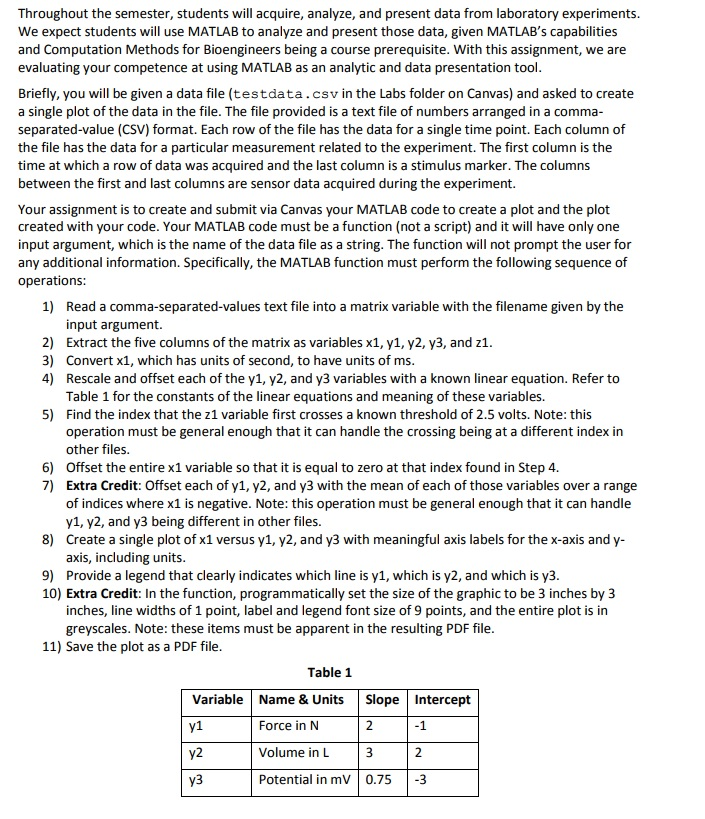
1) Read a comma-separated-values text file into a matrix variable with the filename given by the input argument.
2) Extract the five columns of the matrix as variables x1, y1, y2, y3, and z1.
3) Convert x1, which has units of second, to have units of ms.
4) Rescale and offset each of the y1, y2, and y3 variables with a known linear equation. Refer to Table 1 for the constants of the linear equations and meaning of these variables.
5) Find the index that the z1 variable first crosses a known threshold of 2.5 volts. Note: this operation must be general enough that it can handle the crossing being at a different index in other files.
6) Offset the entire x1 variable so that it is equal to zero at that index found in Step 4.
7) Extra Credit: Offset each of y1, y2, and y3 with the mean of each of those variables over a range of indices where x1 is negative. Note: this operation must be general enough that it can handle y1, y2, and y3 being different in other files.
8) Create a single plot of x1 versus y1, y2, and y3 with meaningful axis labels for the x-axis and yaxis, including units.
9) Provide a legend that clearly indicates which line is y1, which is y2, and which is y3.
10) Extra Credit: In the function, programmatically set the size of the graphic to be 3 inches by 3 inches, line widths of 1 point, label and legend font size of 9 points, and the entire plot is in greyscales. Note: these items must be apparent in the resulting PDF file.
11) Save the plot as a PDF file.

function [x1,y1,y2,y3,z1] = dataimport(f) f = csvread(f)
x1 = x1.*1000; y1 = 2.*y1 - 1; y2 = 3.*y2 +1; y3 = 0.75.*y3 -3;
z1_idx = find(z1 == 2.5) x1(z1_idx) = 0
plot(x1,y1,x1,y2,x1,y3)
end
Throughout the semester, students will acquire, analyze, and present data from laboratory experiments We expect students will use MATLAB to analyze and present those data, given MATLAB's capabilities and Computation Methods for Bioengineers being a course prerequisite. With this assignment, we are evaluating your competence at using MATLAB as an analytic and data presentation tool Briefly, you will be given a data file (testdata.csv in the Labs folder on Canvas) and asked to create a single plot of the data in the file. The file provided is a text file of numbers arranged in a comma separated-value (CSV) format. Each row of the file has the data for a single time point. Each column of the file has the data for a particular measurement related to the experiment. The first column is the time at which a row of data was acquired and the last column is a stimulus marker. The columns between the first and last columns are sensor data acquired during the experiment. Your assignment is to create and submit via Canvas your MATLAB code to create a plot and the plot created with your code. Your MATLAB code must be a function (not a script) and it will have only one input argument, which is the name of the data file as a string. The function will not prompt the user for any additional information. Specifically, the MATLAB function must perform the following sequence of operations Read a comma-separated-values text file into a matrix variable with the filename given by the input argument. Extract the five columns of the matrix as variables x1, y1, y2, y3, and z1 Convert x1, which has units of second, to have units of ms Rescale and offset each of the y1, y2, and y3 variables with a known linear equation. Refer to Table 1 for the constants of the linear equations and meaning of these variables. Find the index that the z1 variable first crosses a known threshold of 2.5 volts. Note: this operation must be general enough that it can handle the crossing being at a different index in other files Offset the entire x1 variable so that it is equal to zero at that index found in Step 4 Extra Credit: Offset each of y1, y2, and y3 with the mean of each of those variables over a range of indices where x1 is negative. Note: this operation must be general enough that it can handle y1, y2, and y3 being different in other files. Create a single plot of x1 versus y1, y2, and y3 with meaningful axis labels for the x-axis and y axis, including units 1) 2) 3) 4) 5) 6) 7) 8) 9) Provide a legend that clearly indicates which line is y1, which is y2, and which is y3 10) Extra Credit: In the function, programmatically set the size of the graphic to be 3 inches by 3 inches, line widths of 1 point, label and legend font size of 9 points, and the entire plot is in greyscales. Note: these items must be apparent in the resulting PDF file 11) Save the plot as a PDF file Table 1 VariableName & Units Slope Intercept Force in N Volume in L Potential in mV0.75 3 y1 -1Step by Step Solution
There are 3 Steps involved in it
Step: 1

Get Instant Access to Expert-Tailored Solutions
See step-by-step solutions with expert insights and AI powered tools for academic success
Step: 2

Step: 3

Ace Your Homework with AI
Get the answers you need in no time with our AI-driven, step-by-step assistance
Get Started


