I have already solved 2a) i just need help with 2b and 2c. The code is in R thank you!
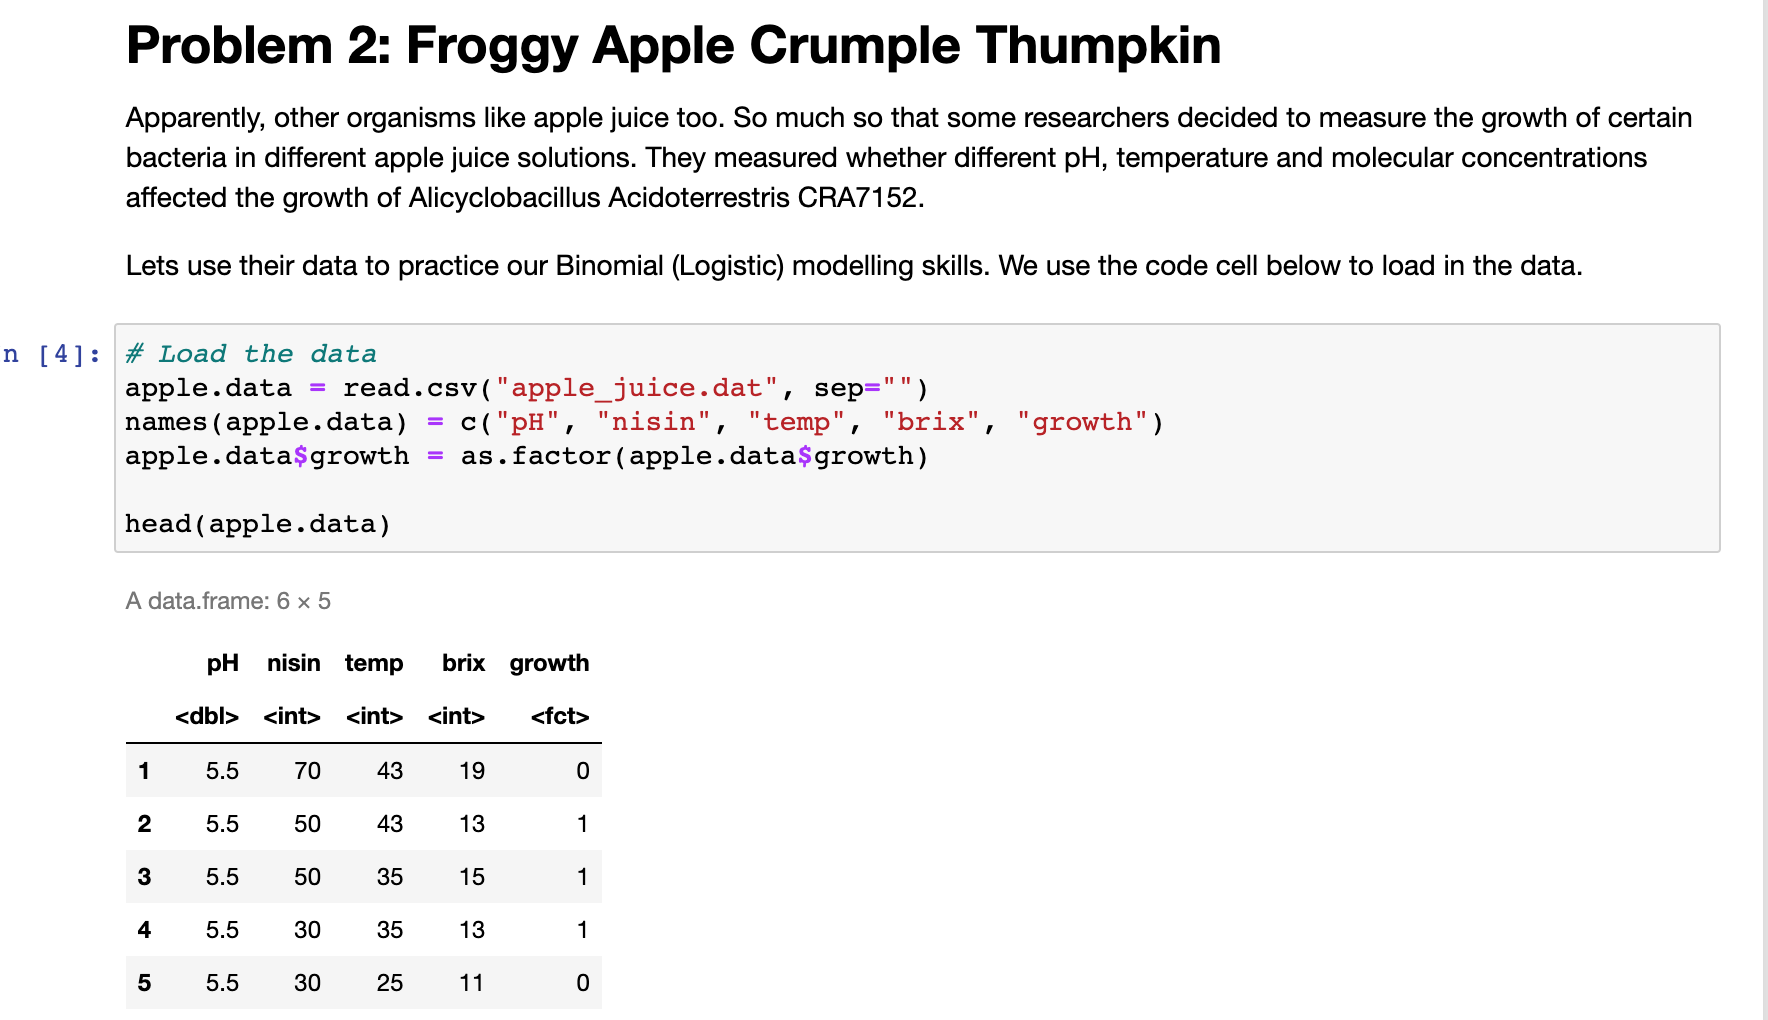
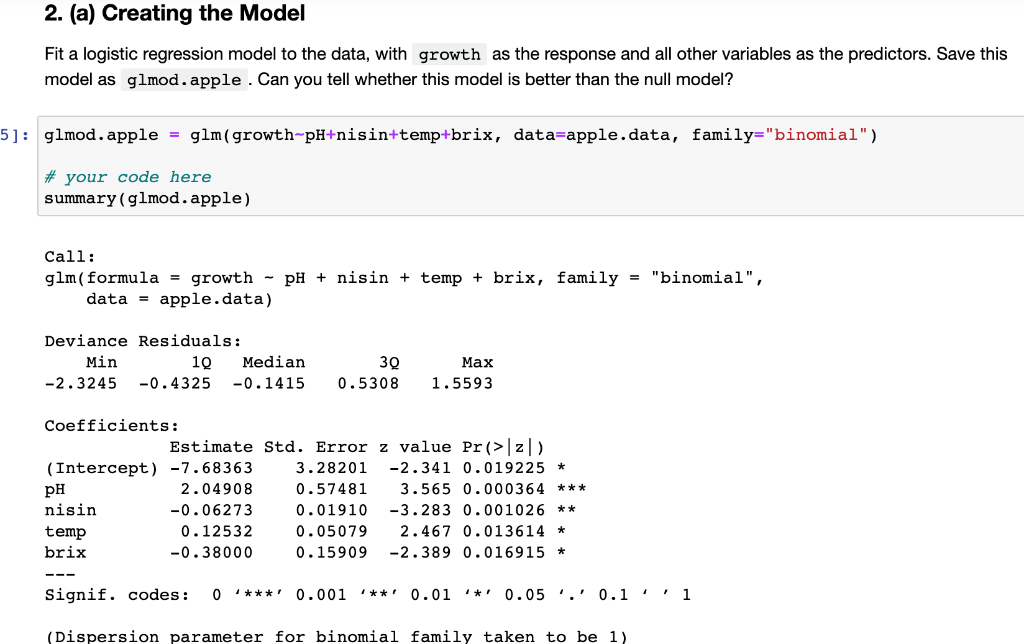
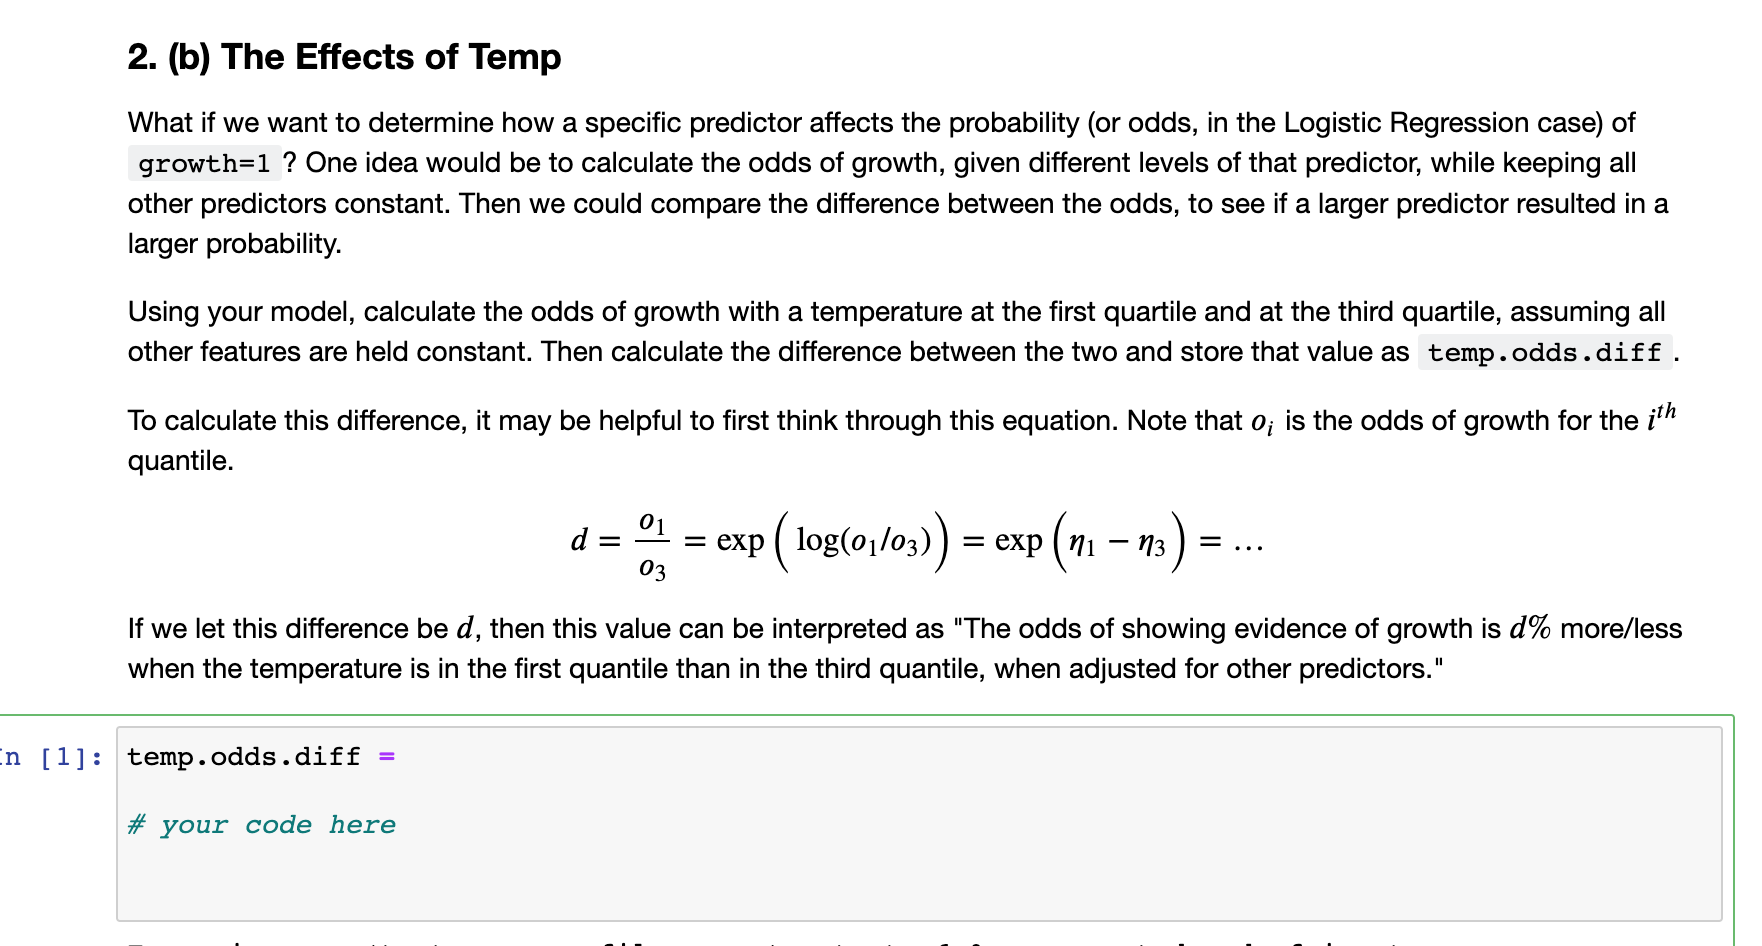
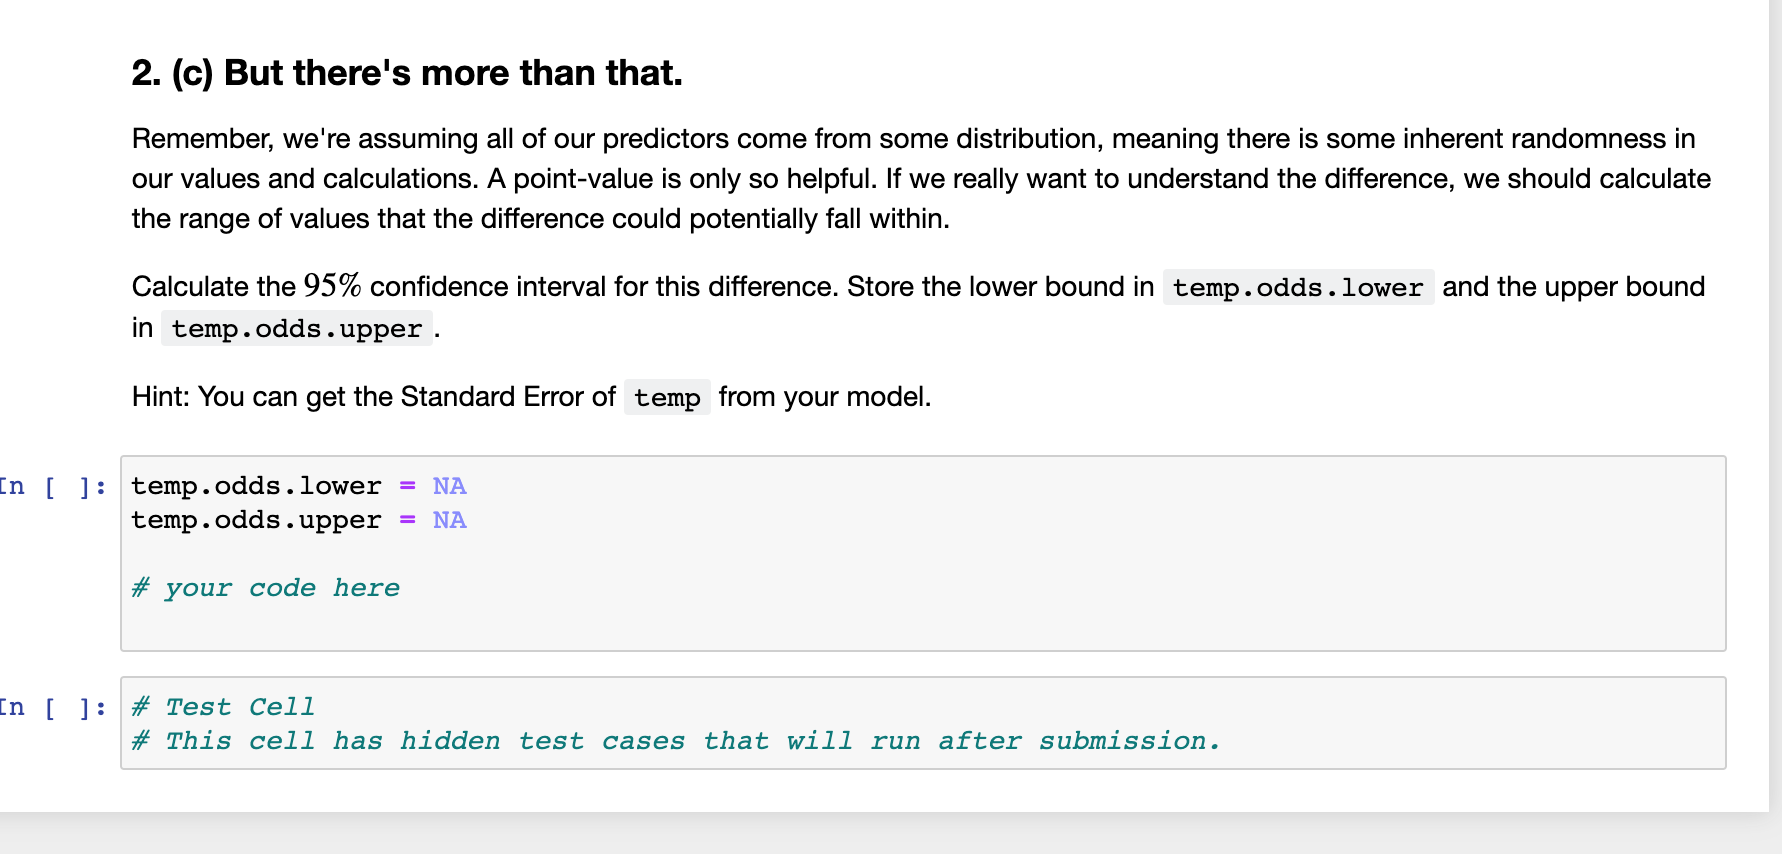
Problem 2: Froggy Apple Crumple Thumpkin Apparently, other organisms like apple juice too. So much so that some researchers decided to measure the growth of certain bacteria in different apple juice solutions. They measured whether different pH, temperature and molecular concentrations affected the growth of Alicyclobacillus Acidoterrestris CRA7152. Lets use their data to practice our Binomial (Logistic) modelling skills. We use the code cell below to load in the data. \# Load the data apple.data = read.csv( "apple_juice.dat", sep=" ") names ( apple.data )=c( "pH", "nisin", "temp", "brix", "growth") apple.data\$growth = as.factor ( apple.data\$growth ) head (apple.data) A data.frame: 65 2. (a) Creating the Model Fit a logistic regression model to the data, with growth as the response and all other variables as the predictors. Save this model as glmod. apple. Can you tell whether this model is better than the null model? 2. (b) The Effects of Temp What if we want to determine how a specific predictor affects the probability (or odds, in the Logistic Regression case) of growth=1 ? One idea would be to calculate the odds of growth, given different levels of that predictor, while keeping all other predictors constant. Then we could compare the difference between the odds, to see if a larger predictor resulted in a larger probability. Using your model, calculate the odds of growth with a temperature at the first quartile and at the third quartile, assuming all other features are held constant. Then calculate the difference between the two and store that value as temp.odds. diff . To calculate this difference, it may be helpful to first think through this equation. Note that oi is the odds of growth for the ith quantile. d=o3o1=exp(log(o1/o3))=exp(13)= If we let this difference be d, then this value can be interpreted as "The odds of showing evidence of growth is d% more/less when the temperature is in the first quantile than in the third quantile, when adjusted for other predictors." 2. (c) But there's more than that. Remember, we're assuming all of our predictors come from some distribution, meaning there is some inherent randomness in our values and calculations. A point-value is only so helpful. If we really want to understand the difference, we should calculate the range of values that the difference could potentially fall within. Calculate the 95% confidence interval for this difference. Store the lower bound in and the upper bound in temp.odds . upper. Hint: You can get the Standard Error of from your model. temp.odds.lower=NAtemp.odds.upper=NA \# your code here \# Test Cell \# This cell has hidden test cases that will run after submission