Answered step by step
Verified Expert Solution
Link Copied!

Question

1 Approved Answer

i have attached images of the question. please answer all parts O Match the plot with a possible description of the sample. 18 2667889 19

i have attached images of the question. please answer all parts
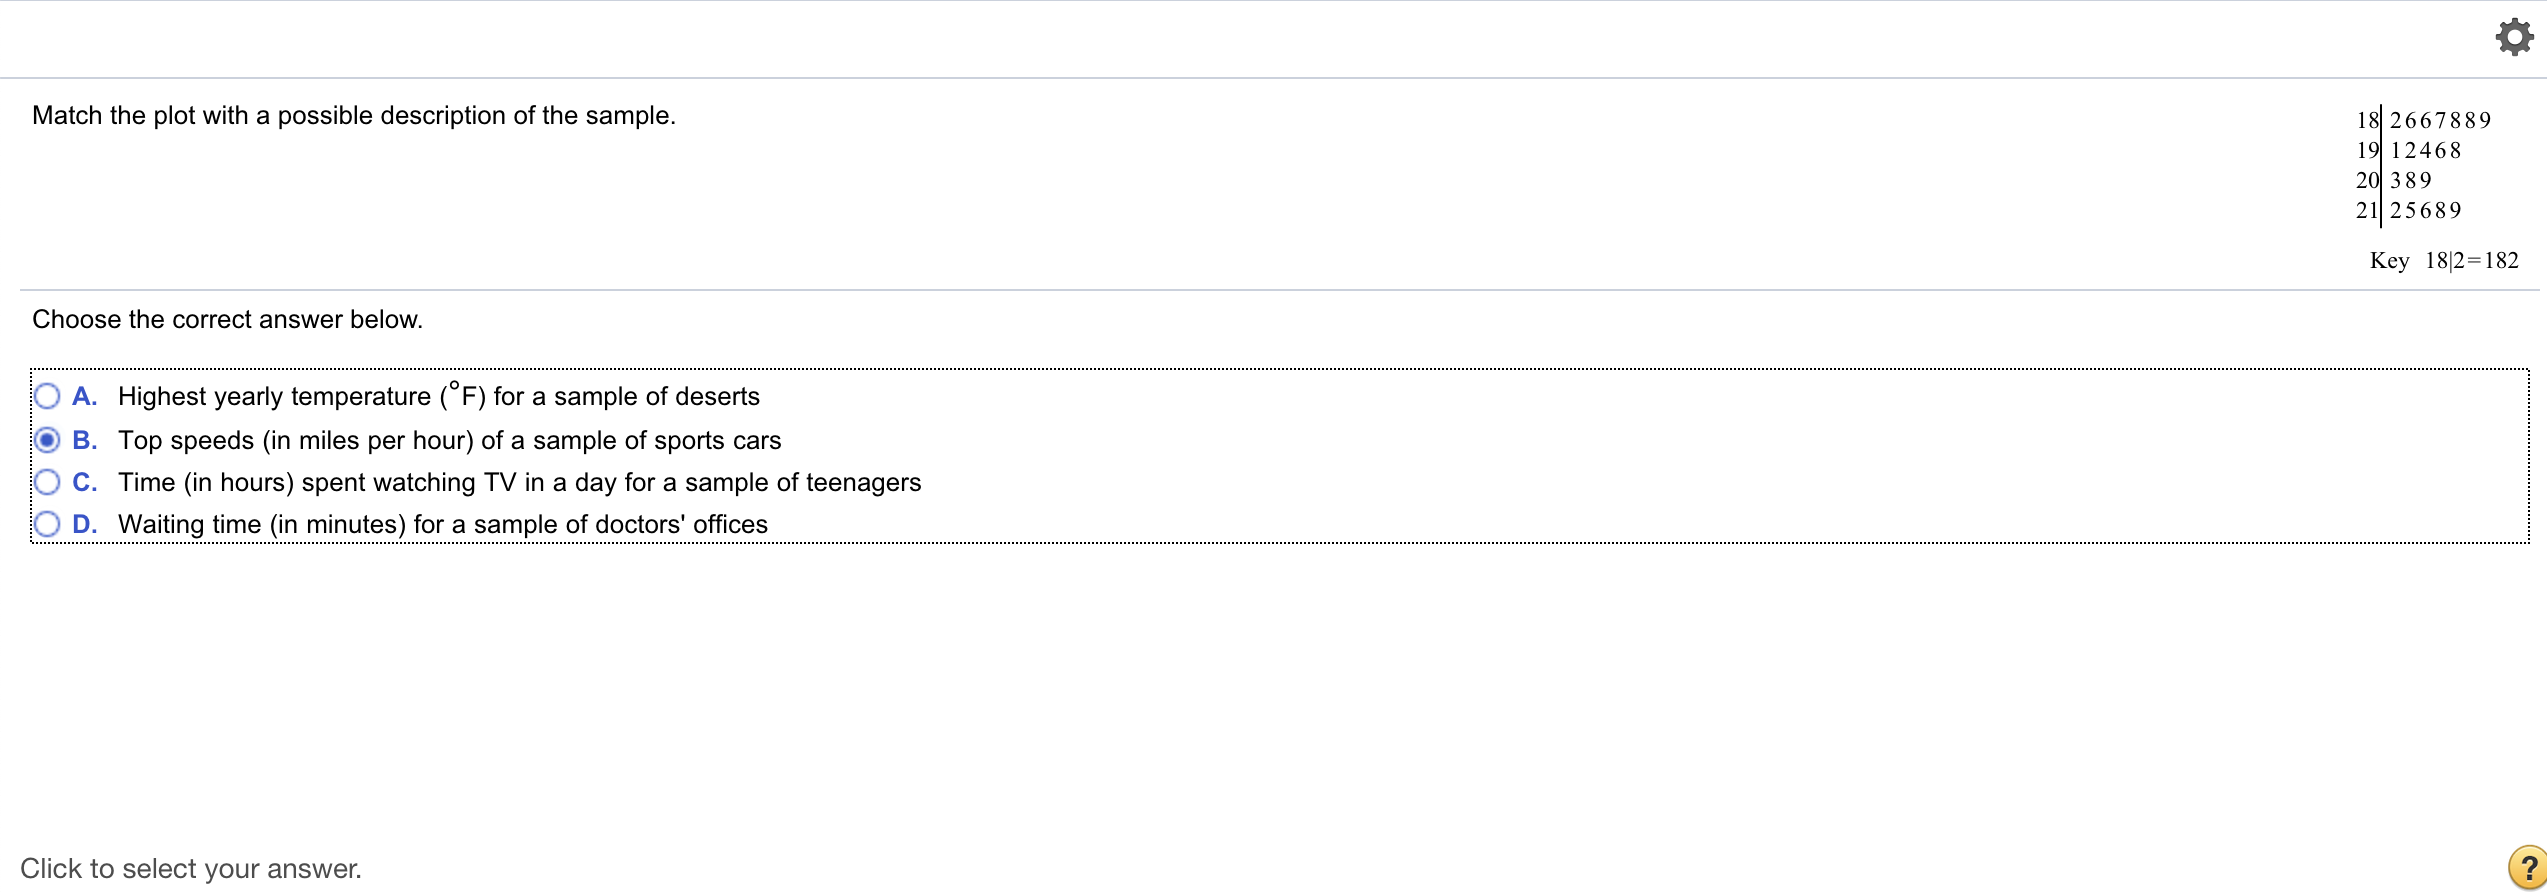
image text in transcribedimage text in transcribedimage text in transcribed
O Match the plot with a possible description of the sample. 18 2667889 19 12468 2 389 21 25689 Key 18l2=182 Choose the correct answer below. 0 A. Highest yearly temperature ( F) for a sample of deserts (Q B. Top speeds (in miles per hour) of a sample of sports cars 0 C. Time (in hours) spent watching TV in a day for a sample of teenagers O D We ng time (in minutes) for a sample of doctors' offices Click to select your answer. @ Find the range of the data set represented by the graph. 70 75 80 85 90 The range of the data set is |:. (Simplify your answer.) Enter your answer in the answer box. The mean value of land and buildings per acre from a sample of farms is $1300, with a standard deviation of $200. The data set has a bell-shaped distribution Assume the number of farms in the sample is 72. (a) Use the empirical rule to estimate the number of farms whose land and building values per acre are between $1100 and $1500. farms (Round to the nearest whole number as needed.) (b) If 26 additional farms were sampled, about how many of these additional farms would you expect to have land and building values between $1100 per acre and $1500 per acre? farms out of 26 (Round to the nearest whole number as needed.) Enter your answer in each of the answer boxes

Step by Step Solution

There are 3 Steps involved in it

Step: 1

blur-text-image

Get Instant Access to Expert-Tailored Solutions

See step-by-step solutions with expert insights and AI powered tools for academic success

Step: 2

blur-text-image

Step: 3

blur-text-image

Ace Your Homework with AI

Get the answers you need in no time with our AI-driven, step-by-step assistance

Get Started

Recommended Textbook for

A Survey of Mathematics with Applications

Authors: Allen R. Angel, Christine D. Abbott, Dennis Runde

10th edition

134112105, 134112342, 9780134112343, 9780134112268, 134112261, 978-0134112107

More Books

Students also viewed these Mathematics questions

Question

4 Is it possible to get support from needed stakeholders?

Answered: 1 week ago