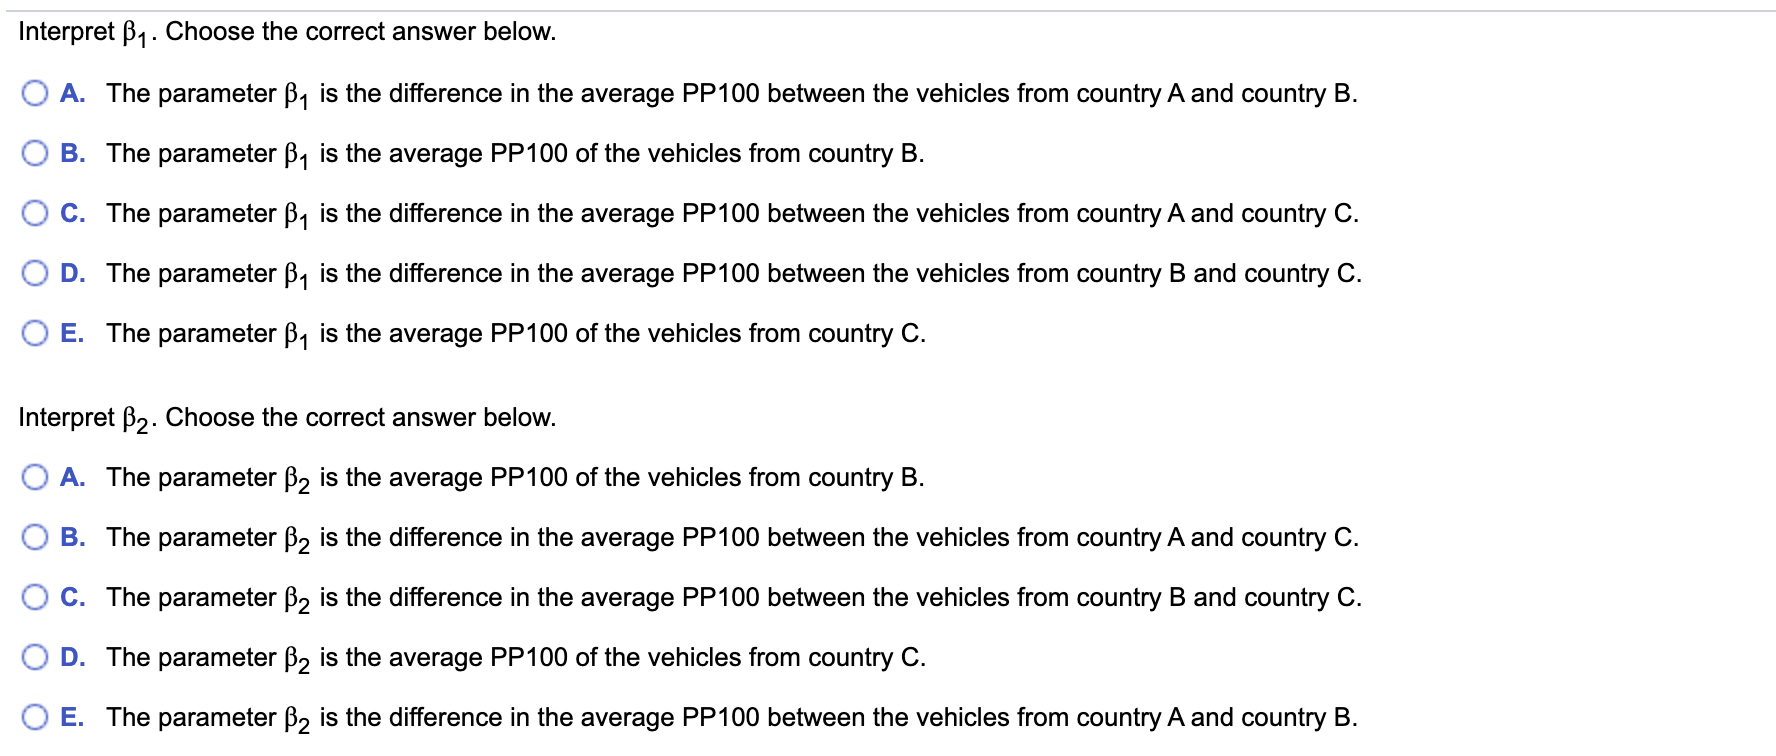
I have attached screenshots of the questions I need help with
\fWhen cars from country A's automobile manufacturers started being imported to country B, they were given very poor quality ratings. That started changing several years ago, The improved quality started being seen in a 2004 study. Results were based on responses from more than 62,000 purchasers and Iessors of new-model-year cars and trucks, who were surveyed after 90 days of ownership, The initial quality is measured by the number of problems per 100 vehicles (PP100). The PP100 dam from the interval 19984004 are shown in the accompanying mble. Complete para a through c. a Click the icon to view the data, 1 'ff B 1 'ff 1 C Produce a regression equation to predict the PP100 for vehicles in the model yi = [50 + [51x1 + [32x2 + e, where x1 = { I rom country and x = { I rom coun ry 0 if not from country B 0 if not from country C h a. |nterpret the parameters [50, [31, and [52 in the model given above. Interpret [30. Choose the correct answer below. 0 A. The parameter [30 is the difference in the average PP100 between the vehicles from country A and country C. B. The parameter [)0 is the average PP100 of the vehicles from country B. O C. The parameter [$0 is the difference in the average PP100 between the vehicles from country A and country B. O D. The parameter [30 is the average PP100 of the vehicles from country C, O E. The parameter [30 is the average PP100 of the vehicles from country A. Interpret By . Choose the correct answer below. O A. The parameter , is the difference in the average PP100 between the vehicles from country A and country B. O B. The parameter , is the average PP100 of the vehicles from country B. O C. The parameter , is the difference in the average PP100 between the vehicles from country A and country C. O D. The parameter , is the difference in the average PP100 between the vehicles from country B and country C. O E. The parameter , is the average PP100 of the vehicles from country C. Interpret B2. Choose the correct answer below. O A. The parameter 2 is the average PP100 of the vehicles from country B. O B. The parameter 2 is the difference in the average PP100 between the vehicles from country A and country C. O C. The parameter 2 is the difference in the average PP100 between the vehicles from country B and country C. O D. The parameter 2 is the average PP100 of the vehicles from country C. O E. The parameter , is the difference in the average PP100 between the vehicles from country A and country B.b. Conduct a test of hypothesis using the model in part a to determine if the average PP100 is the same for the three international automobile production regions. Use at = 0.05. Identify the null and alternative hypotheses for this test. Choose the correct answer below. OA. 00. OE. H05 130 =1 =0 HA: At least one iao H0: At least one Bi 0 HA3 ['1 = 52 = 0 Ho: At least one Bi 0 HA1 50:91 =l'2 =0 A.:,.,;, ,,.,,L,,,,, ,,,,,,,,,, - Ho5o=1=z= HA: At least one [3i #0 - H0151 =l32= HA: At least one Bi #0 Ho: [50 =l32 =0 HA: At least one [Siam


