Answered step by step
Verified Expert Solution
Link Copied!

Question

1 Approved Answer

I have attached the 4 questions I am working on, along with the data set used to answer the questions. Unfortunately I missed classes due

I have attached the 4 questions I am working on, along with the data set used to answer the questions. Unfortunately I missed classes due to a sickness so I am a little lost on where to even begin. How should i go about answering these questions?

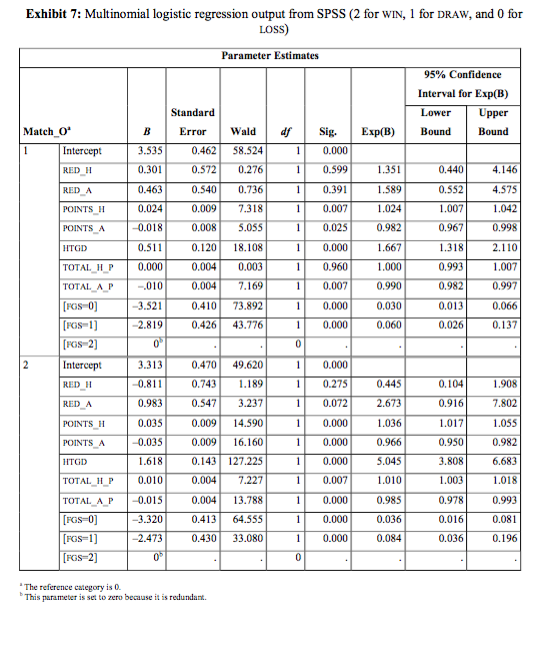
image text in transcribedimage text in transcribed
1. Write the equation that Peter can use for predicting the probability of win ll' the home team (coded as 2) using statistically signicant variables {use d = {1.05). 2. What is the inuence on the match output of red cards conceded by the home and the away team? Discuss the possible reams for the empirical evidence om the model. 3. Is it relevant to use the points scored by a team in the previous season for predicting the outcome of a match? 4. What is the probability that the home team will win the match for the values shown in the following table?l Exhibit 7: Multinomial logistic regression output from SPSS (2 for WIN, 1 for DRAW, and 0 for LOSS) Parameter Estimates 95% Confidence Interval for Exp(B) Standard Lower Upper Match_O' Error Wald df Sig. Exp(B) Bound Bound Intercept 3.535 0.462 58.524 0.000 RED H 0.301 0.572 0.276 0.599 1.351 0.440 4.146 RED A 0.463 0.540 0.736 0.391 1.589 0.552 4.575 POINTS H 0.024 0.009 7.318 0.007 1.024 1.007 1.042 POINTS A -0.018 0.008 5.055 0.025 0.982 0.967 0.998 HTGD 0.511 0.120 18.108 0.000 1.667 1.318 2.110 TOTAL H P D.000 0,004 1,003 0.960 1.000 0,993 1.007 TOTAL A P -.010 0,004 7.169 0.007 0.990 0.982 0.997 FGS 0 -3.521 0.410 73.892 0.000 0,030 0.013 0,066 [FGS-1] 2.819 0.426 43.776 0.000 0.060 0.026 0.137 [FGS 2] 2 Intercept 3.313 0.470 49.620 0.000 RED H -0.81 1 0.743 1.189 0.275 0.445 0.104 1.908 RED A 0.983 0.547 3.237 0.072 2.673 0.916 7.802 POINTS H 0.035 0.009 14.590 D.000 1.036 1.017 1.055 POINTS A 0.035 0.009 16.160 0.000 0.966 0.950 0.982 HTGD 1.618 0.143 127.225 0.000 5.045 3.808 6.683 TOTAL H P 0.010 0.004 7.227 0.007 1.010 1.003 1.018 TOTAL A P 0.015 0.004 13.788 0.000 0.985 0.978 0.993 [FOS 0] -3.320 0.413 64.555 0.000 0.036 0.016 0.081 [FGS-1] -2.473 0.430 33.080 0.000 0.084 0.036 0.196 [FOS 2] The reference category is 0. This parameter is set to zero because it is redundant

Step by Step Solution

There are 3 Steps involved in it

Step: 1

blur-text-image

Get Instant Access to Expert-Tailored Solutions

See step-by-step solutions with expert insights and AI powered tools for academic success

Step: 2

blur-text-image

Step: 3

blur-text-image

Ace Your Homework with AI

Get the answers you need in no time with our AI-driven, step-by-step assistance

Get Started

Recommended Textbook for

An Introduction to the Mathematics of financial Derivatives

Authors: Salih N. Neftci

2nd Edition

978-0125153928, 9780080478647, 125153929, 978-0123846822

More Books

Students also viewed these Mathematics questions

Question

6. What kinds of shipping needs are best met by a courier and why?

Answered: 1 week ago

Question

Comment on the pH value of lattice solutions of salts.

Answered: 1 week ago