

Answered step by step
Verified Expert Solution
Question
1 Approved Answer
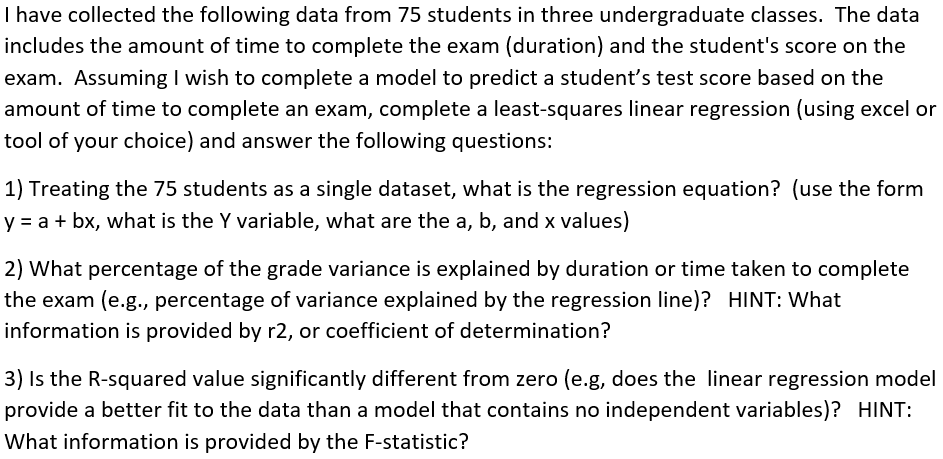
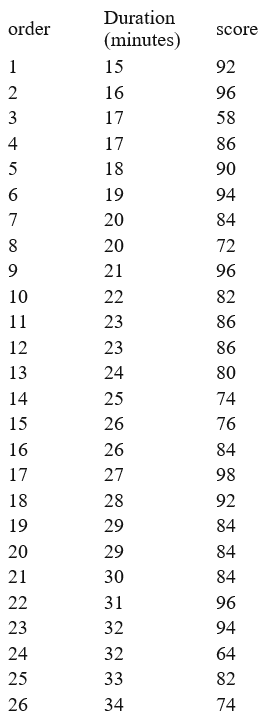
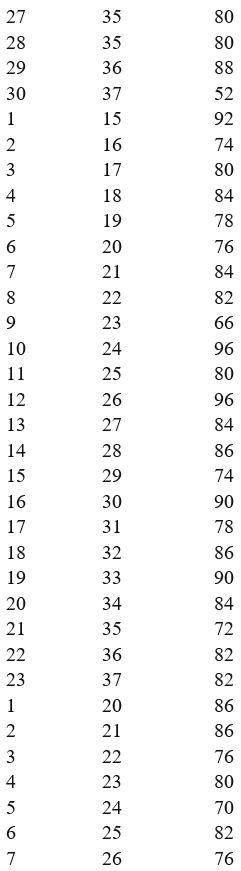
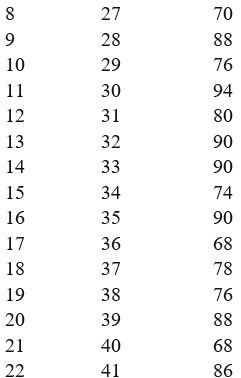
I have collected the following data from 75 students in three undergraduate classes. The data includes the amount of time to complete the exam (duration)
Step by Step Solution
There are 3 Steps involved in it
Step: 1

Get Instant Access to Expert-Tailored Solutions
See step-by-step solutions with expert insights and AI powered tools for academic success
Step: 2

Step: 3
Ace Your Homework with AI
Get the answers you need in no time with our AI-driven, step-by-step assistance
Get Started
Intermediate Financial Management
Authors: Eugene F. Brigham, Phillip R. Daves
8th Edition
0324258917, 9780324258912