

Question
I have created the create the scatterplot below in SPSS and plotted the line of best fit (regression line) on the graph. 1. How can
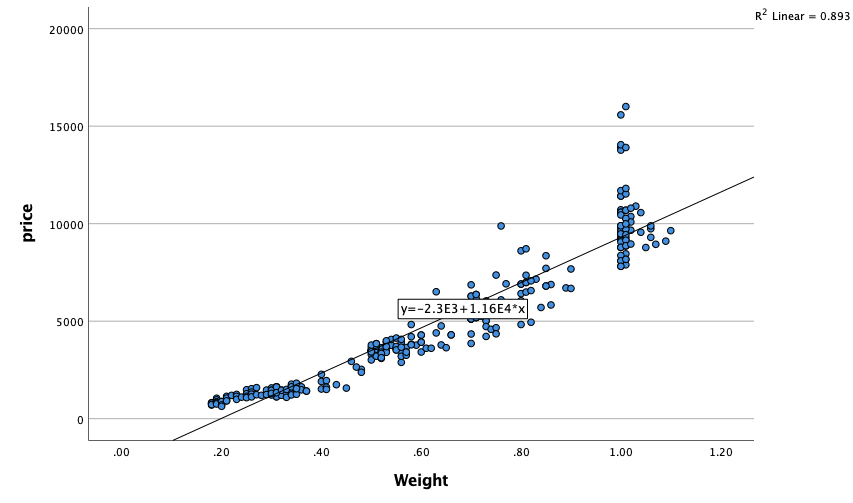
I have created the create the scatterplot below in SPSS and plotted the line of best fit (regression line) on the graph.
1. How can I indicate what the scatterplot indicates regarding the predictability of the dependent variable (price)?

Step by Step Solution
There are 3 Steps involved in it
Step: 1

Get Instant Access to Expert-Tailored Solutions
See step-by-step solutions with expert insights and AI powered tools for academic success
Step: 2

Step: 3
Ace Your Homework with AI
Get the answers you need in no time with our AI-driven, step-by-step assistance
Get Started
Elementary Number Theory
Authors: Charles Vanden Eynden
2nd Edition
1478639113, 9781478639114