Answered step by step
Verified Expert Solution
Question
1 Approved Answer
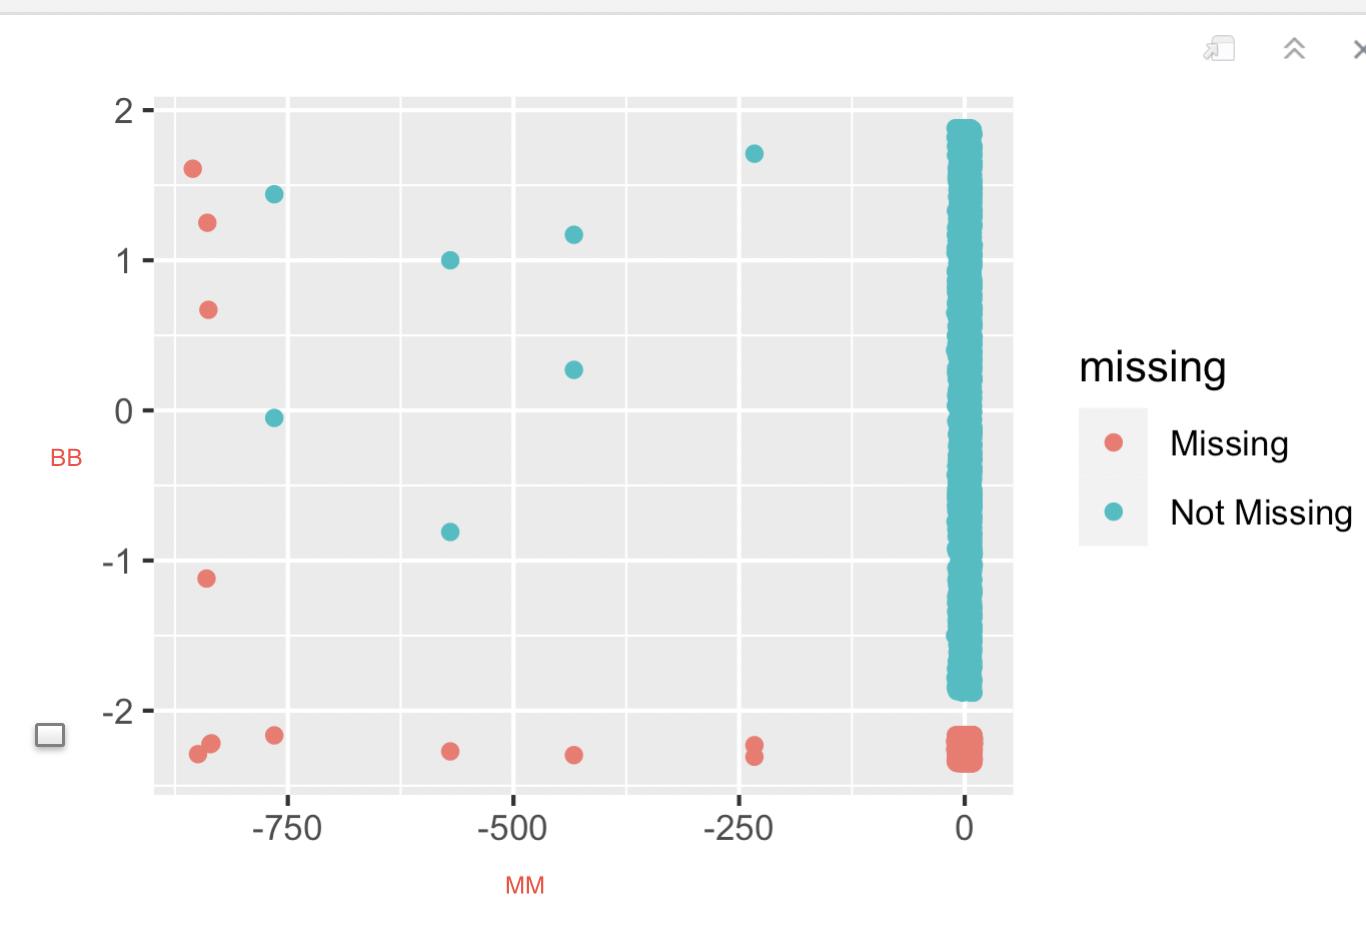
I have data of 5000 rows and 9 variables. But 2000 is missing data on the variable BB. Using the geom_miss_point in R crossing the
- I have data of 5000 rows and 9 variables. But 2000 is missing data on the variable BB. Using the geom_miss_point in R crossing the target variable MM and BB i realized some very strong outliers in MM. So what should I do next? handling the missing values or the outlier?

2- 1- BB 0- -1- -2- -750 -500 -250 0 MM missing Missing Not Missing >
Step by Step Solution
There are 3 Steps involved in it
Step: 1

Get Instant Access to Expert-Tailored Solutions
See step-by-step solutions with expert insights and AI powered tools for academic success
Step: 2

Step: 3

Ace Your Homework with AI
Get the answers you need in no time with our AI-driven, step-by-step assistance
Get Started


