Answered step by step
Verified Expert Solution
Link Copied!

Question

1 Approved Answer

I have no idea how to go about solving these two questions. 1. Have a look at this graphic. How correlated are the two variables?

I have no idea how to go about solving these two questions.
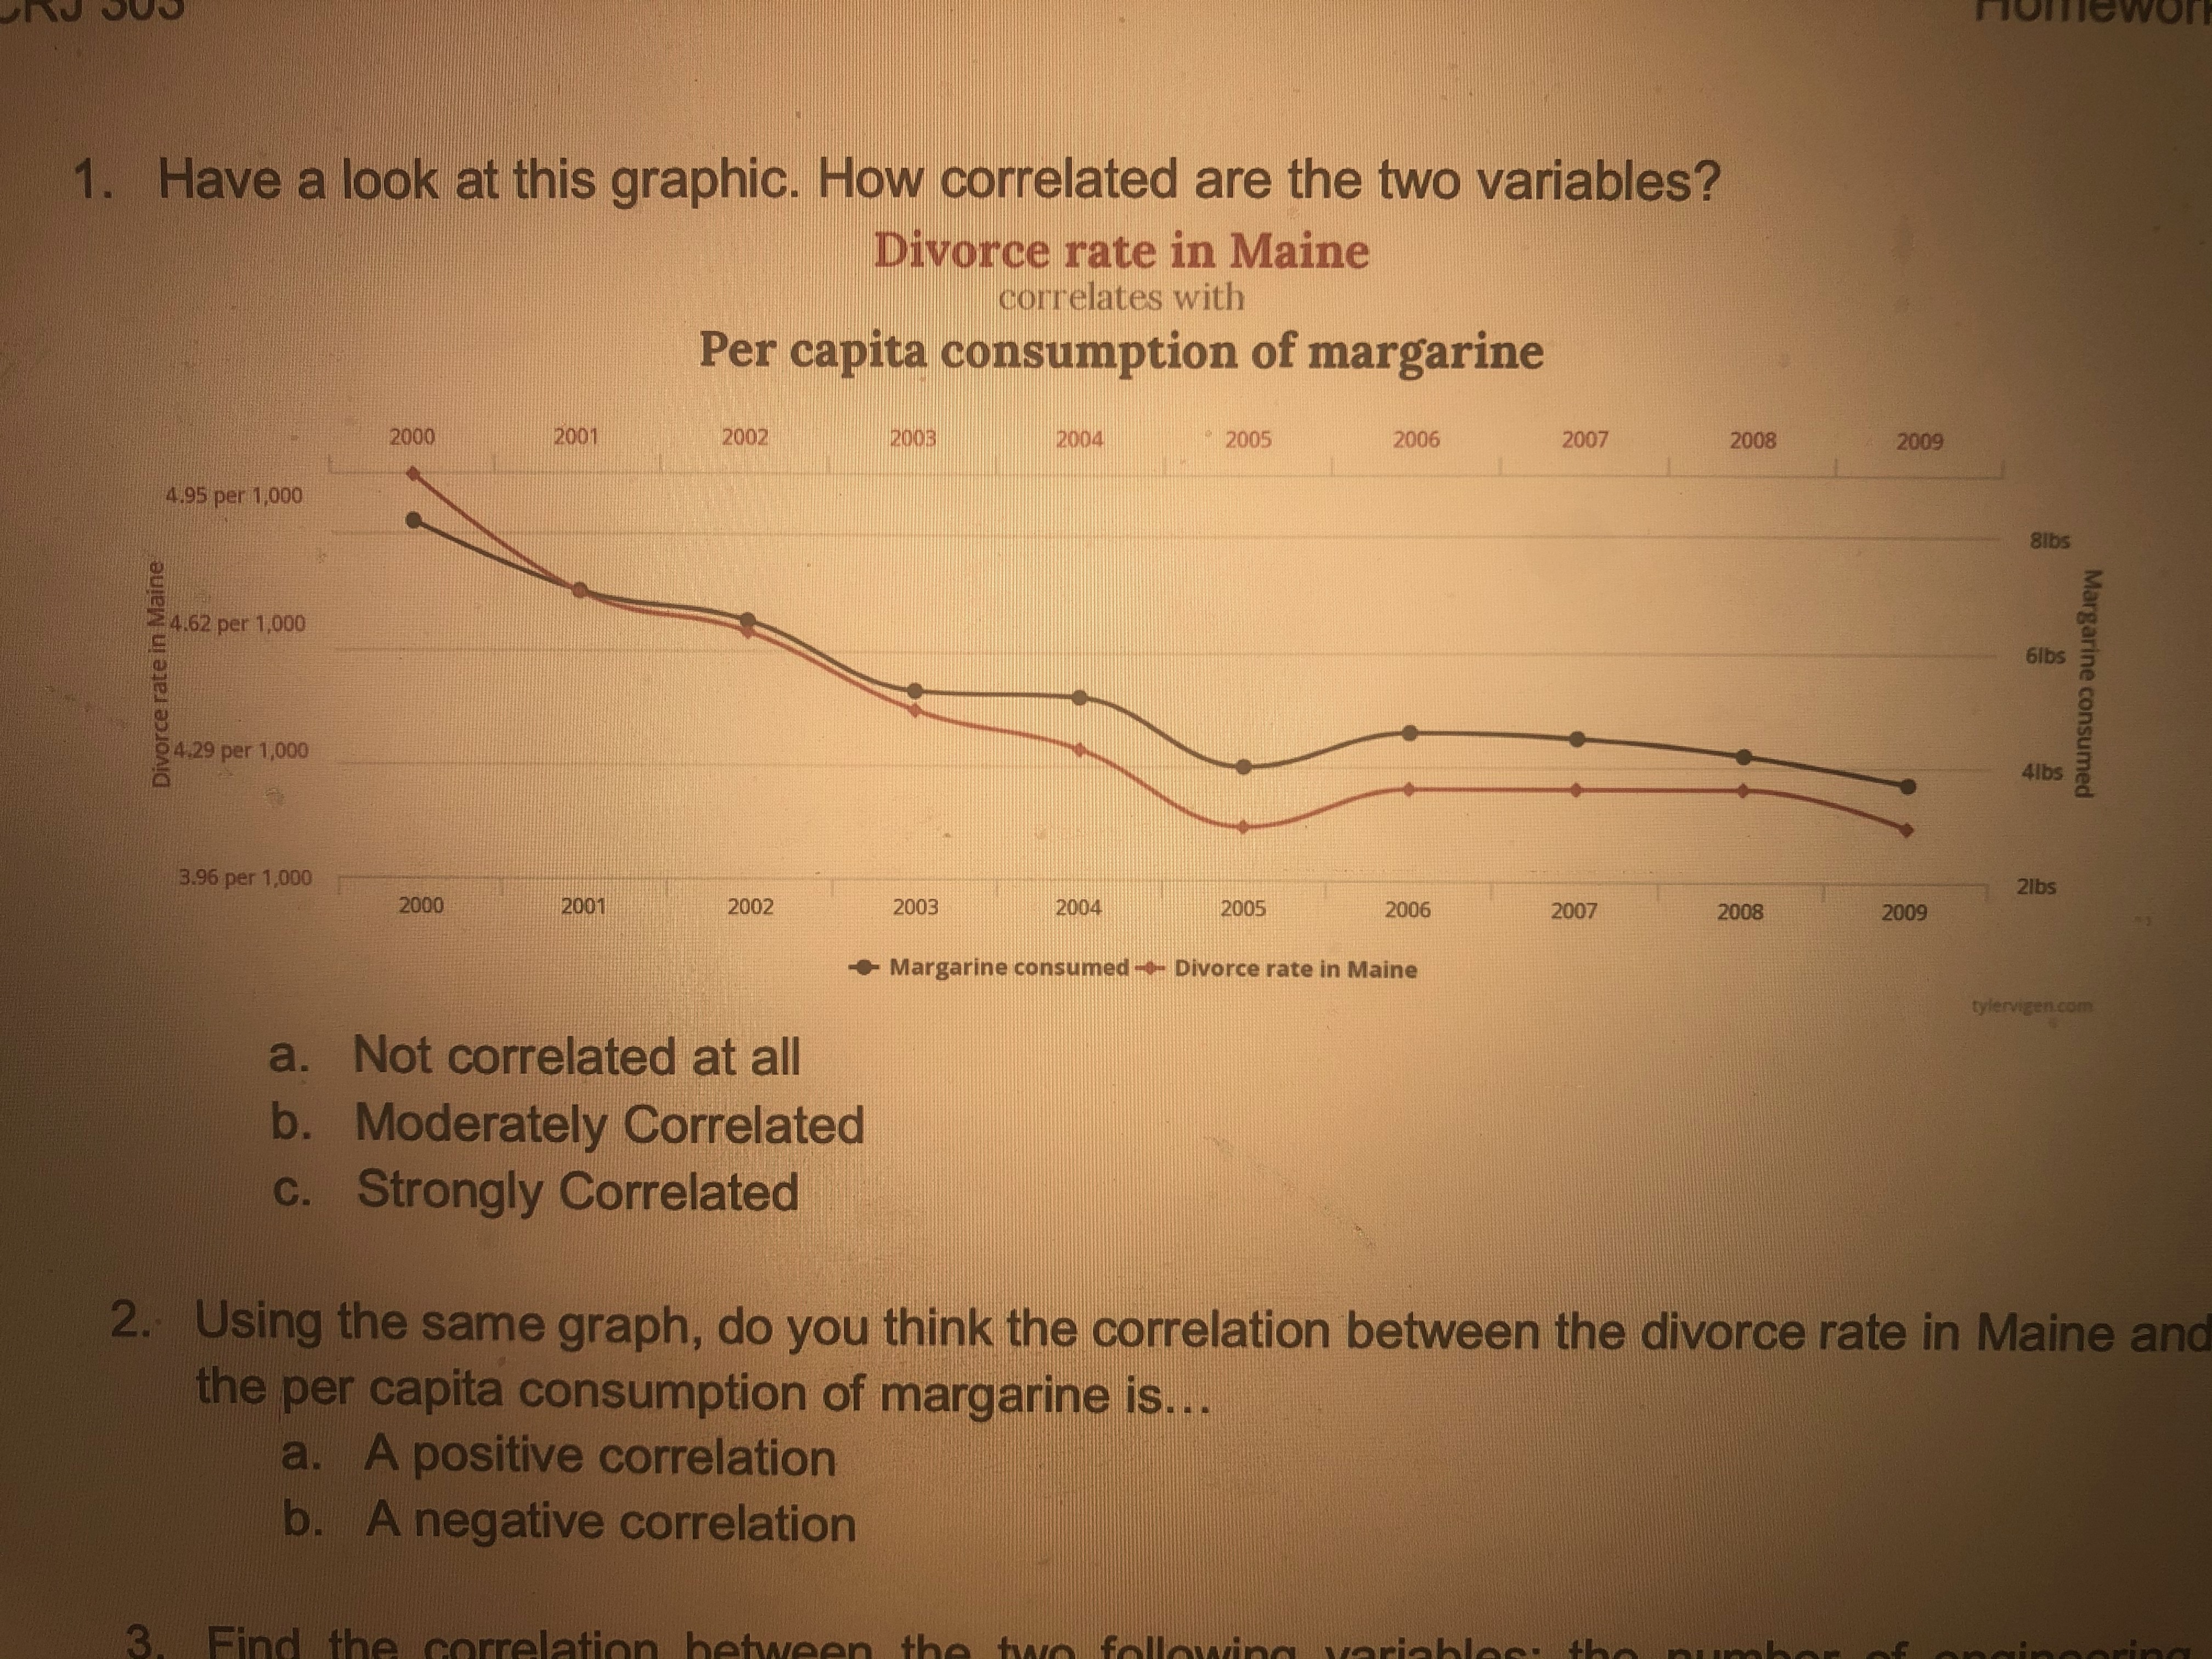
image text in transcribed
1. Have a look at this graphic. How correlated are the two variables? Divorce rate in Maine correlates with Per capita consumption of margarine 2000 2001 2002 2003 2004 2005 2006 2007 2008 2009 4.95 per 1,000 Bibs 4.62 per 1,000 bibs Divorce rate in Maine Margarine consumed 9 4.29 per 1,000 4lbs 3.96 per 1,000 2lbs 2000 2001 2002 2003 2004 2005 2006 2007 2008 2009 Margarine consumed - - Divorce rate in Maine tylervigen.com a. Not correlated at all b. Moderately Correlated c. Strongly Correlated 2. Using the same graph, do you think the correlation between the divorce rate in Maine and the per capita consumption of margarine is.. . a. A positive correlation b. A negative correlation Find the

Step by Step Solution

There are 3 Steps involved in it

Step: 1

blur-text-image

Get Instant Access to Expert-Tailored Solutions

See step-by-step solutions with expert insights and AI powered tools for academic success

Step: 2

blur-text-image

Step: 3

blur-text-image

Ace Your Homework with AI

Get the answers you need in no time with our AI-driven, step-by-step assistance

Get Started

Recommended Textbook for

Intro Stats

Authors: Richard D. De Veaux, Paul F. Velleman, David E. Bock

3rd edition

321533283, 321533289, 9780321463708, 9780321503848, 9780321503800, 9780321499431, 9780321499417, 978-0321500458

More Books

Students also viewed these Mathematics questions

Question

Question in Chemical Engineering Please Write Correct answer 8 3 .

Answered: 1 week ago