

Question
I have secondary data on doctor mistakes (outcome variable) for all 50 states in USA by doctor specialty. I mean real numbers per state. I
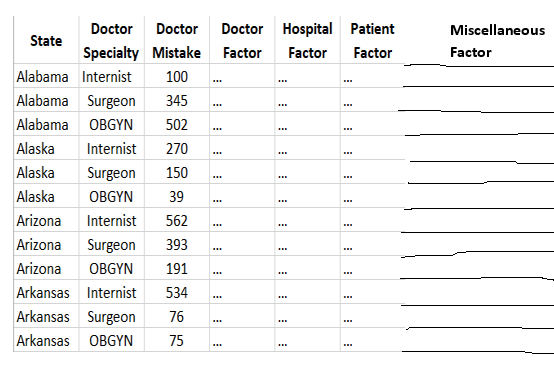
I have secondary data on doctor mistakes (outcome variable) for all 50 states in USA by doctor specialty. I mean real numbers per state. I want to assess the relationship between doctor mistakes (outcome variable) and state of doctor practice (predictor #1) and doctor specialty (Predictor #2) (internist, Surgeon and OBGYN).I want to adjust for the following confounders: provider factor, hospital factor, patient factor and miscellaneous factor. I don't have real data for these 4 confounders.
Hypotheses:
1. no association or interaction between doctor mistake and state of doctor practice
2. no association or interaction between doctor mistake and doctor specialty
I want to do 2-way ANOVA using SPSS and my Excel table currently looks like this (other states not shown here):
Step by Step Solution
There are 3 Steps involved in it
Step: 1

Get Instant Access to Expert-Tailored Solutions
See step-by-step solutions with expert insights and AI powered tools for academic success
Step: 2

Step: 3
Ace Your Homework with AI
Get the answers you need in no time with our AI-driven, step-by-step assistance
Get Started
Linear Algebra with Applications
Authors: Steven J. Leon
7th edition
131857851, 978-0131857858