I have the code for the first 5 parts. I need help with part 6import matplotlib.pyplot as pltimport seaborn as sbimport pandas as pdimport numpy as npimport osos.chdir('C:\\Users\\Teezy\\PycharmProjects\\pythonProject1\\CLASS\\Data Files')pd.set_option('display.max_columns', None)data = pd.read_csv('mtcars.csv')dataFrame = data[['Car Name', 'cyl', 'gear', 'hp', 'mpg']]dataFrame.rename(columns ={'cyl': 'Cylinder', 'gear': 'Gear', 'hp': 'HorsePower', 'mpg': 'Miles Per Gallon'}, inplace=True)# Part 1 & 2print(dataFrame.set_index('Car Name'))#Part 3part4 = dataFrame.sort_values(by=['HorsePower', 'Miles Per Gallon'], ascending=[False, True])print(part4)#Part 4print(part4.loc[part4['Gear'] >= 4])#Part 5print(part4.loc[part4['Miles Per Gallon'] > 20])
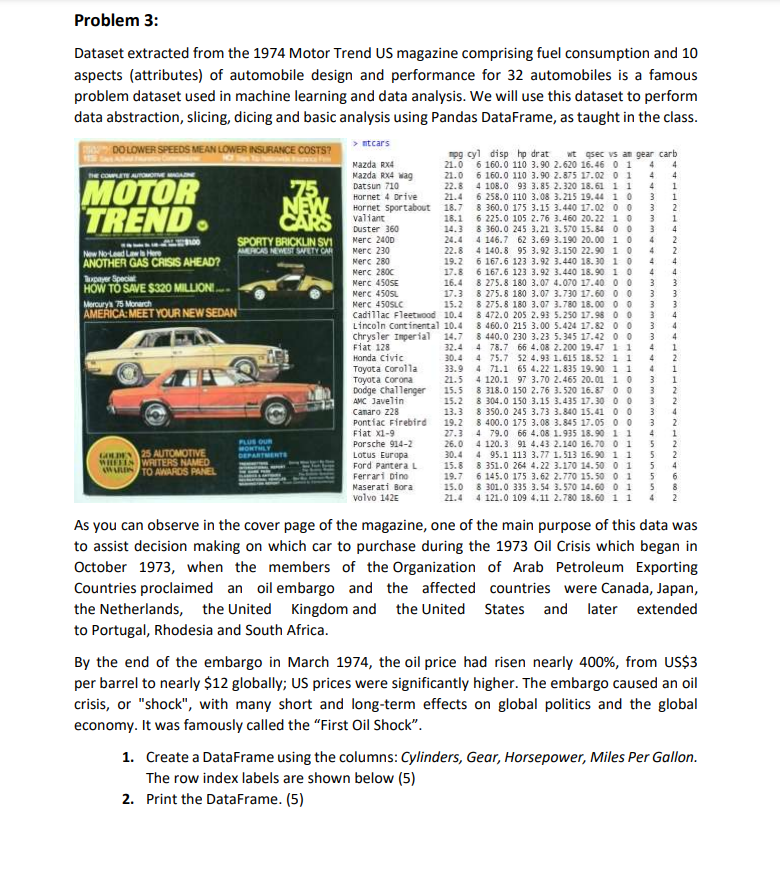
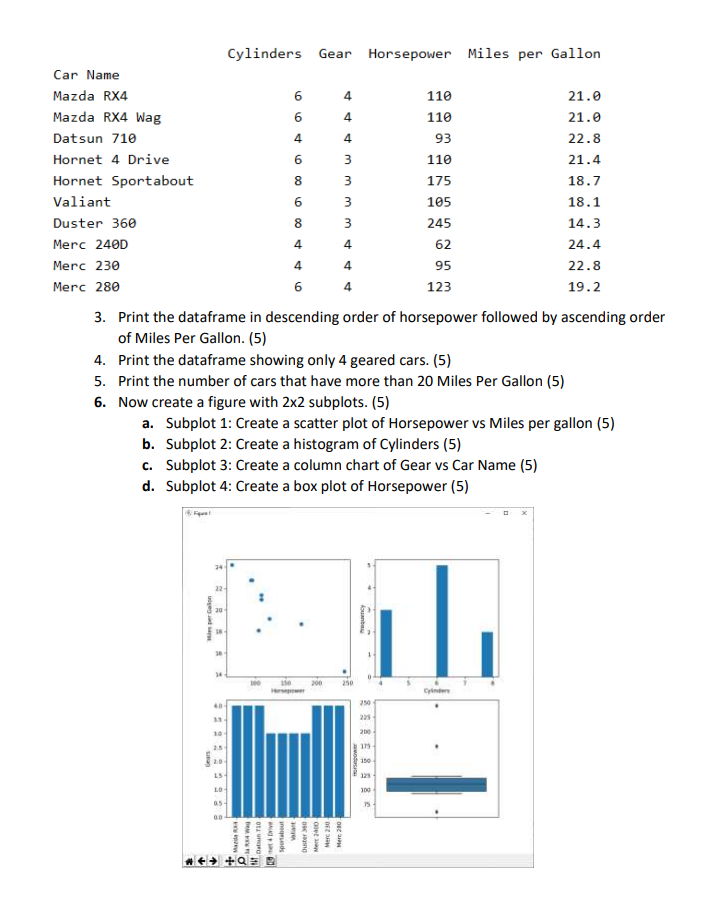
Problem 3: Dataset extracted from the 1974 Motor Trend US magazine comprising fuel consumption and 10 aspects (attributes) of automobile design and performance for 32 automobiles is a famous problem dataset used in machine learning and data analysis. We will use this dataset to perform data abstraction, slicing, dicing and basic analysis using Pandas DataFrame, as taught in the class. DO LOWER SPEEDS MEAN LOWER INSURANCE COSTS? nitcars opg cyl disp hp drat wt qsec vs an gear carb Mazda RX4 21.0 6 160.0 110 3. 90 2. 620 16.4 0 Mazda RX4 Wag 21.0 6 160.0 110 3. 90 2. 875 17.02 0 MOTOR Datsun 710 22. 8 4 108.0 93 3. 85 2. 320 Hornet 4 Drive 21.4 6 2580 110 3.08 3.215 19.46 ww ww t t 18.7 5 360.0 175 3.15 3. 440 17-02 0 TREND . Hornet sportabout valiant 18.1 6 225.0 105 2.76 3.48 Duster 360 8 360.0 245 3. 21 3. 570 15.84 SPORTY BRICKLIN SVI Merc 2400 24.4 4 146.7 62 3. 69 3.1 0 20. 0 AMERICAS MIMIT SALTY CALI Merc 230 22. 6 4 140.8 95 3. 92 3.150 22.90 ANOTHER GAS CRISIS AHEAD? Merc 280 19.2 6 167.6 123 3. 92 3.440 Merc 280c 17. 8 6 167.6 123 3. 92 3.440 HOW TO SAVE $320 MILLION!.... Merc 450SE 16.4 8 275.8 180 3.07 4. 070 17.40 0 Merc 4505L 17,3 8 275. 5 180 3. 07 3.7 Mercury's 75 Monarch Merc 450SLC 15.2 8 275.8 180 3. 07 3.780 AMERICA: MEET YOUR NEW SEDAN Cadillac Fleetwood 10.4 8 472.0 205 2.93 5.250 17 Lincoln Continental 10.4 8 460.0 215 3. 00 5.4 chrysler Imperial 14.7 8 440.0 230 3. 23 5.345 Fiat 128 32.4 4 78.7 66 4. 08 2.200 Honda Civic 30.4 75.7 52 4. 93 1. 615 18 Toyota Corolla 33. 9 4 71.1 65 4. 22 1. 835 19.90 Toyota Corona 21.5 4 120.1 97 3. 70 2.4 Dodge challenger 15.5 8 318.0 150 2. 76 3. 520 16.87 AMC Javelin 15.2 8 304 0 150 3.15 3.435 Camaro Z28 13.3 8 350.0 245 3.73 3. 540 15.41 0 Pont fac Firebird 19.2 8 400.0 175 3. 08 3. 845 17.05 0 Fiat X1-9 27. 3 4 79.0 66 4.08 1.935 FLU'S CUS Porsche 914-2 26.0 4 120.3 91 4.43 2.140 16. 25 AUTOMOTIVE DEPARTMENT Lotus Europa 30.4 WHITES 4 95.1 113 3.77 1. 513 WHITERS NAMED TO AWARDS PANEL Ford pantera L 15. 8 8 351.0 264 4.22 3.170 Ferrari Dino 19.7 6 145.0 175 3. 62 2.770 Maserati Bora 15.0 8 301.0 335 3. 54 3.3 Volvo 142E 21.4 4 121 0 109 4.11 2. 780 18.60 As you can observe in the cover page of the magazine, one of the main purpose of this data was to assist decision making on which car to purchase during the 1973 Oil Crisis which began in October 1973, when the members of the Organization of Arab Petroleum Exporting Countries proclaimed an oil embargo and the affected countries were Canada, Japan, the Netherlands, the United Kingdom and the United States and later extended to Portugal, Rhodesia and South Africa. By the end of the embargo in March 1974, the oil price had risen nearly 400%, from US$3 per barrel to nearly $12 globally; US prices were significantly higher. The embargo caused an oil crisis, or "shock", with many short and long-term effects on global politics and the global economy. It was famously called the "First Oil Shock". 1. Create a DataFrame using the columns: Cylinders, Gear, Horsepower, Miles Per Gallon. The row index labels are shown below (5) 2. Print the DataFrame. (5)Cylinders Gear Horsepower Miles per Gallon Car Name Mazda RX4 110 21.0 Mazda RX4 Wag 110 21.0 Datsun 710 93 22.8 wwwapp Hornet 4 Drive 110 21.4 Hornet Sportabout 175 18.7 Valiant 105 18.1 Duster 360 245 14.3 Merc 240D 62 24.4 Merc 230 95 22.8 Merc 280 123 19.2 3. Print the dataframe in descending order of horsepower followed by ascending order of Miles Per Gallon. (5) 4. Print the dataframe showing only 4 geared cars. (5) 5. Print the number of cars that have more than 20 Miles Per Gallon (5) 6. Now create a figure with 2x2 subplots. (5) a. Subplot 1: Create a scatter plot of Horsepower vs Miles per gallon (5) b. Subplot 2: Create a histogram of Cylinders (5) c. Subplot 3: Create a column chart of Gear vs Car Name (5) d. Subplot 4: Create a box plot of Horsepower (5) 34 12 my per Gallon 200 Merc Fiu Sportabout Mert 7400 Dinner 380 Datsun Tag