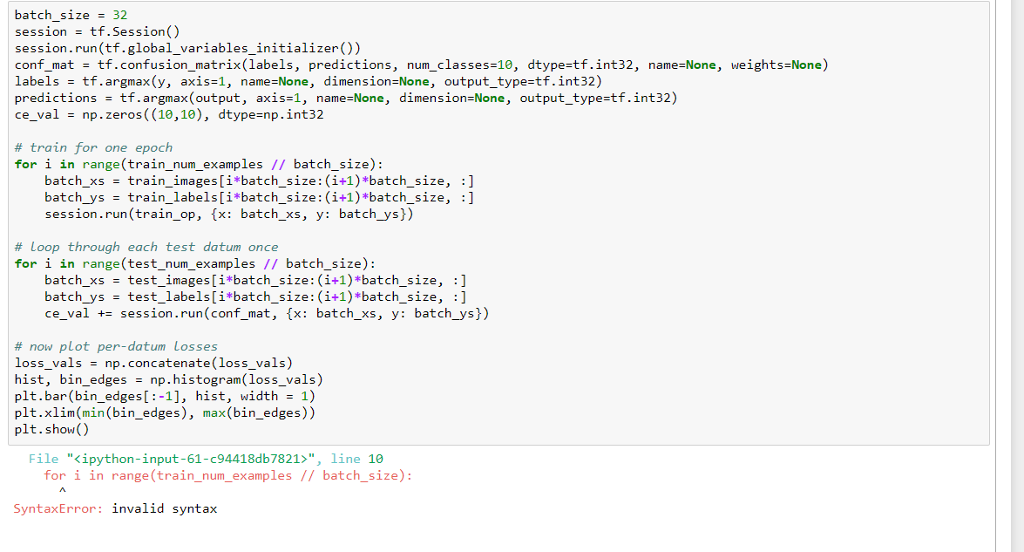
I have uploaded my answer here, but i wonder what I am doing wrong. Would you kindly look at my code here and explain what I'm doing is wrong? I assume it got something to do with how i defined my confusion matrix. Also any fix for why the for loop is giving me an error?
question is Write code to calculate the maximum a posteriori (MAP) estimate of the model on the test data, and compare to the true labels to calculate a confusion matrix with tf.confusion_matrix. (For the inexperienced, what is a confusion matrix?)
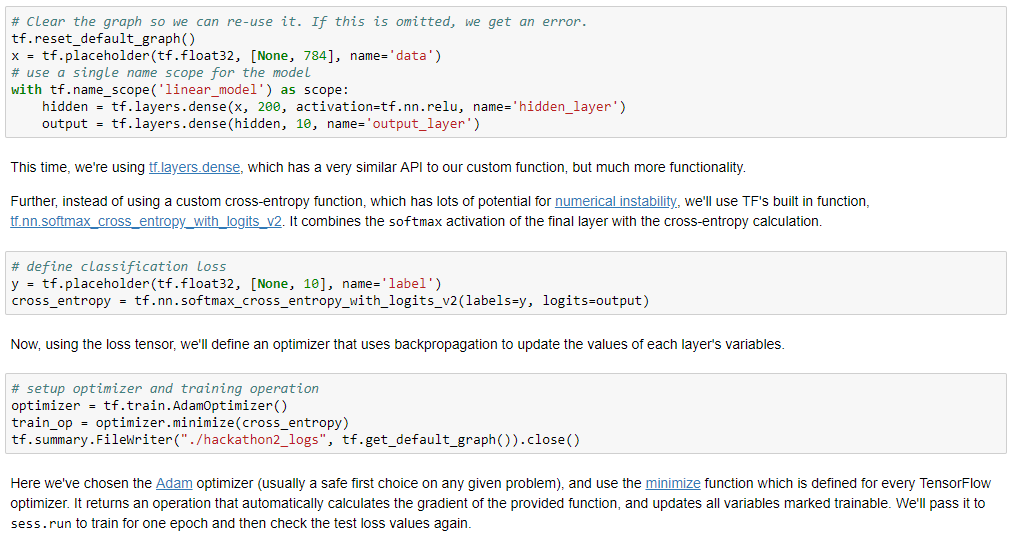
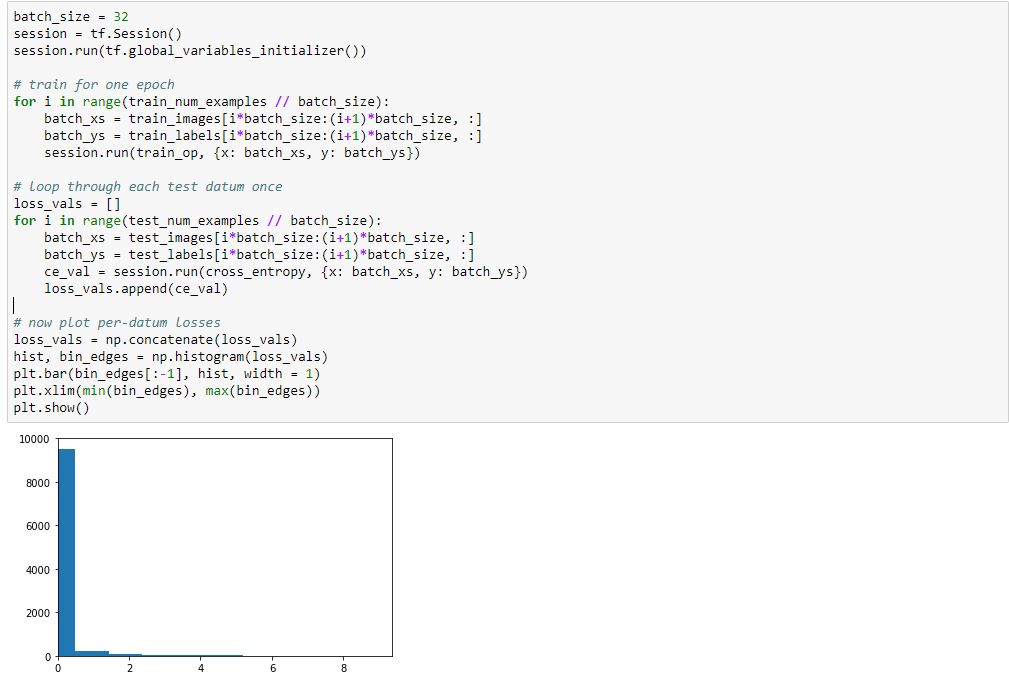
(Hint #0: Re-use and modify the code from below. I have posted them after my answer)
(Hint #1: The MAP estimate is just the class whose probability is greatest. I reccomend using tf.argmax with the correct axis argument to find this to find the max over the correct dimension of the output.)
(Hint #2: tf.confusion_matrix is a function that needs be run in a session.run call that returns matrices. Store the resulting matrices in a list and then sum to get the matrix for the full test dataset. Remember to specify the num_classes argument.)
My answer:
 the code to use for hints;

batch_size- 32 session-tf.Session() session.run(tf.global_variables_initializer()) conf-mat tf.confusion, matrix(labels, predictions, num classes-10, dtype=tf.int32, name-None, labels tf.argmax(y, axis-1, name None, dimension None, output type-tf.int32) predictions tf.argmax(output, ax15-1, name-None, dimension=None, output-type=tf.int32) ce val = np. zeros ((10,10), dtype-np.int32 weights=None) # train for one epoch for i in range(train_num_examples // batch_size) batch_xs -train_images [i*batch_size:(i+1)*batch_size, batch-ys train-labels[jtbatch-size: (1+1)*batch-size, session.run(train_op, (x: batch_xs, y: batch_ysj) :] :] # Loop through each test datum once for i in range(test_num_examples // batch_size): batch_xs -test_images[i*batch_size: (i+1)*batch_size, :] batch_ys-test_labels[i*batch_size: (i+1)*batch_size, :] ce_va1 += session.run(conf-mat, {x: batch-xs, y: batch-ys}) # now plot per-datum Losses loss_vals np.concatenate(loss_vals) hist, bin-edges = np.histogram(loss_vals pit . bar(bin-edges(:-1], hist, width = 1) plt.xlim(min(bin_edges), max(bin_edges) plt.show() File "
", line 1e for i in range(train_num_ examples// batch_size): SyntaxError: invalid syntax # clear the graph so we can re-use it. If this is omitted, we get an error. tf.reset_default_graph() x - tf.placeholder (tf.float32, [None, 784], name- 'data') # use a single name scope for the model with tf.name_scope ('linear_model') as scope: hidden - tf.layers.dense(x, 2e0, activation-tf.nn.relu, name-'hidden_layer') output tf.layers.dense(hidden, 1e, name- 'output_layer') This time, we're using tt layers dense, which has a very similar API to our custom function, but much more functionality. Further, instead of using a custom cross-entropy function, which has lots of potential for numerical instability, we'll use TF's built in function, tt nn softmax cross entropy with logits 2. It combines the softmax activation of the final layer with the cross-entropy calculation. # define classification Loss y - tf.placeholder (tf.float32, [None, 10], name- 'label') cross-entropy-tf.nn . softmax-cross-entropy-with-logts_v2(1abels-, logts-output) Now, using the loss tensor, we'll define an optimizer that uses backpropagation to update the values of each layer's variables. # setup optimizer and training operation optimizer -tf.train.AdamOptimizer() train_op -optimizer.minimize(cross_entropy) tf.summary.Filewriter("./hackathon2_logs", tf.get_default_graph()).close() Here we've chosen the Adam optimizer (usually a safe first choice on any given problem), and use the minimize function which is defined for every TensorFlow optimizer. It returns an operation that automatically calculates the gradient of the provided function, and updates all variables marked trainable. We'll pass it to sess.run to train for one epoch and then check the test loss values again. batch_size-32 session-tf.Session() session.run (tf.global_variables_initializer()) # train for one epoch for i in range (train_num_examples /7 batch_size): batch xs-train_images[i*batch_size:(i+1) *batch_size, :] batch ys-train_labels[i*batch_size:(i+1) *batch_size, :] session.run(train_op, {x: batch_xs, y: batch_ys) # Loop through each test datum once loss_vals[] for i in range(test_num_examples // batch_size): batch_xs-test_images[i batch_size:(i+1) *batch_size, :] batch ys-test_labels[i batch size:(i+1)*batch_size, :] ce_val - session.run(cross_entropy, fx: batch_xs, y: batch_ys]) loss_vals.append (ce_val) # now plot per-datum Losses loss_valsnp.concatenate (loss_vals) hist, bin_edges np.histogram(loss_vals) plt.bar(bin_edges[-1], hist, width-1) plt.xlim(min(bin_edges), max(bin_edges)) plt.show() 10000 8000 6000 4000 2000
 the code to use for hints;


