Answered step by step
Verified Expert Solution
Question
1 Approved Answer
I: (Horizontal analysis - Increase /Decrease Method) Following is the comparative statement of financial position of SPINACH Company: NIVS Current Assets Plant Assets Total
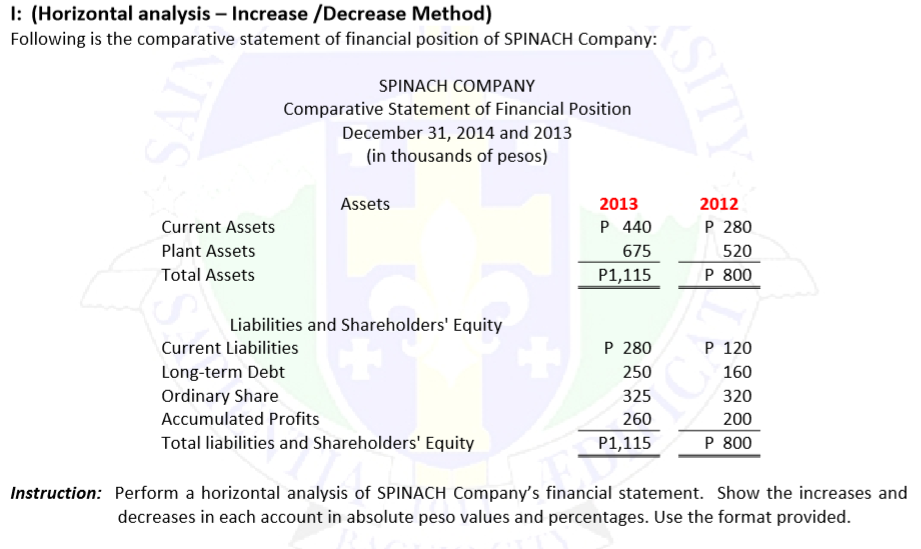
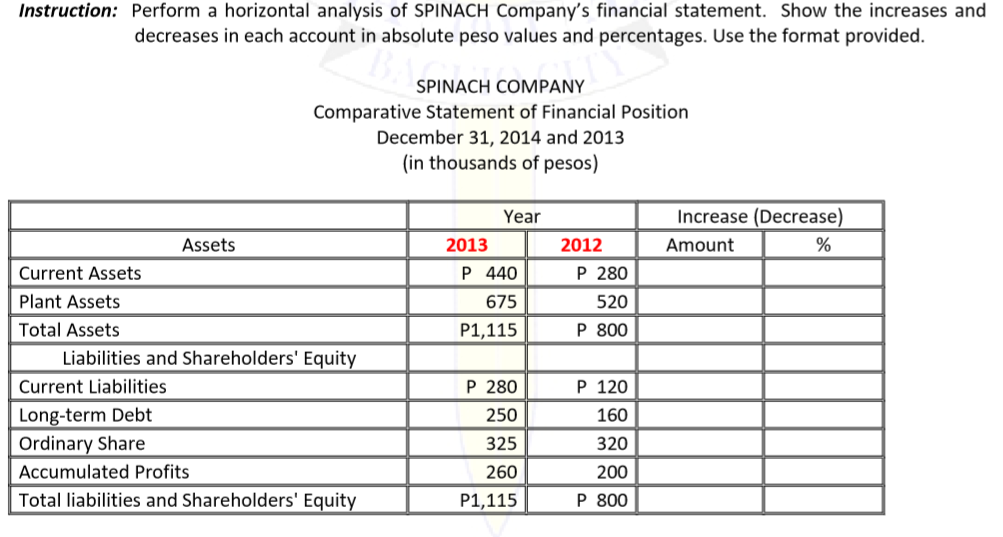
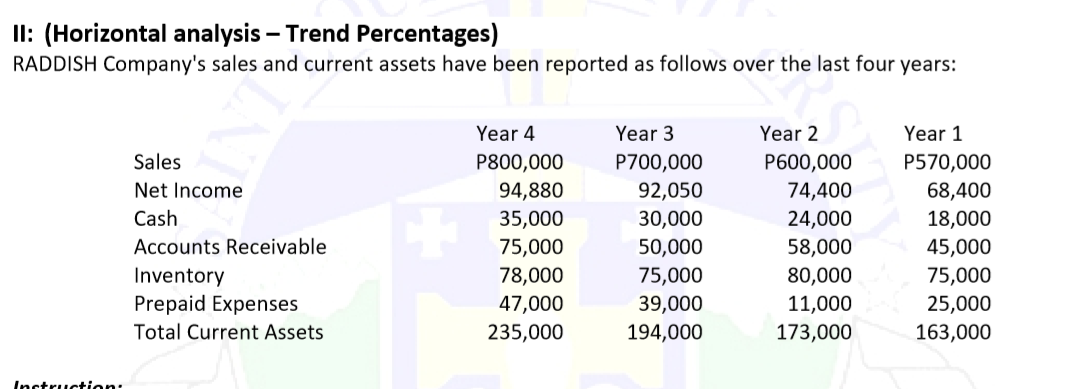
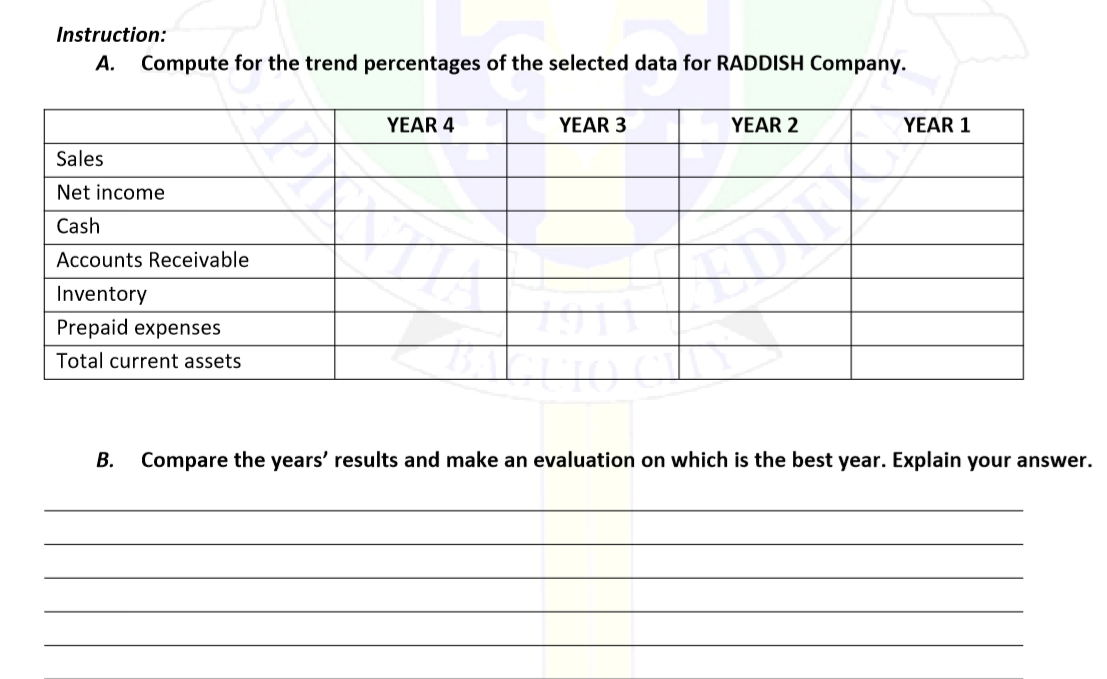
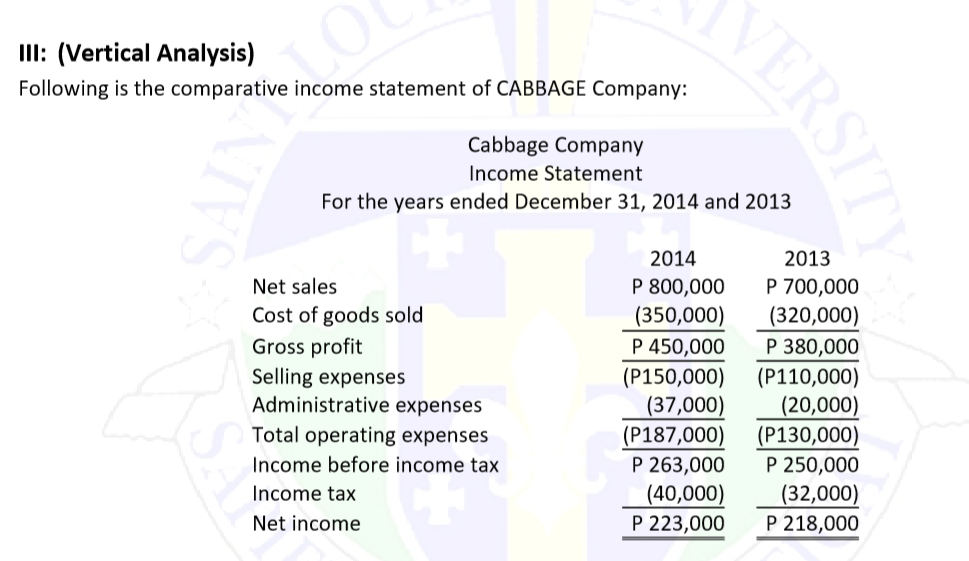
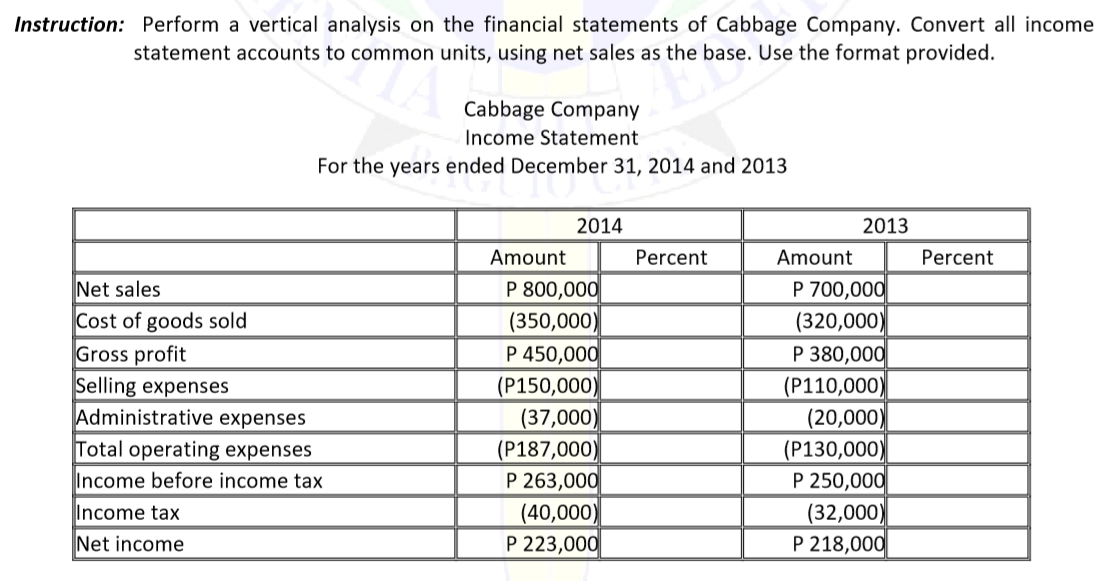
I: (Horizontal analysis - Increase /Decrease Method) Following is the comparative statement of financial position of SPINACH Company: NIVS Current Assets Plant Assets Total Assets C SPINACH COMPANY Comparative Statement of Financial Position December 31, 2014 and 2013 (in thousands of pesos) Assets Liabilities and Shareholders' Equity Current Liabilities Long-term Debt Ordinary Share Accumulated Profits Total liabilities and Shareholders' Equity 2013 P 440 675 P1,115 P 280 250 325 260 P1,115 SITY 2012 P 280 520 P 800 P 120 160 320 200 P 800 Instruction: Perform a horizontal analysis of SPINACH Company's financial statement. Show the increases and decreases in each account in absolute peso values and percentages. Use the format provided. Instruction: Perform a horizontal analysis of SPINACH Company's financial statement. Show the increases and decreases in each account in absolute peso values and percentages. Use the format provided. Current Assets Plant Assets Total Assets Assets Current Liabilities Long-term Debt Ordinary Share SPINACH COMPANY Comparative Statement of Financial Position December 31, 2014 and 2013 (in thousands of pesos) Liabilities and Shareholders' Equity Accumulated Profits Total liabilities and Shareholders' Equity 2013 Year P 440 675 P1,115 P 280 250 325 260 P1,115 2012 P 280 520 P 800 P 120 160 320 200 P 800 Increase (Decrease) Amount % II: (Horizontal analysis - Trend Percentages) RADDISH Company's sales and current assets have been reported as follows over the last four years: Instruction: Sales Net Income Cash Accounts Receivable Inventory Prepaid Expenses Total Current Assets Year 4 P800,000 94,880 35,000 75,000 78,000 47,000 235,000 Year 3 P700,000 92,050 30,000 50,000 75,000 39,000 194,000 Year 2 P600,000 74,400 24,000 58,000 80,000 11,000 173,000 Year 1 P570,000 68,400 18,000 45,000 75,000 25,000 163,000 Instruction: A. Compute for the trend percentages of the selected data for RADDISH Company. Sales Net income Cash Accounts Receivable Inventory Prepaid expenses Total current assets YEAR 4 YEAR 3 YEAR 2 YEAR 1 B. Compare the years' results and make an evaluation on which is the best year. Explain your answer. OPINIVS III: (Vertical Analysis) Following is the comparative income statement of CABBAGE Company: Cabbage Company Income Statement Net sales Cost of goods sold Gross profit Selling expenses For the years ended December 31, 2014 and 2013 VERSITY. Administrative expenses Total operating expenses Income before income tax Income tax Net income 2014 P 800,000 (350,000) P 450,000 (P150,000) (37,000) (P187,000) P 263,000 (40,000) P 223,000 2013 P 700,000 (320,000) P 380,000 (P110,000) (20,000) (P130,000) P 250,000 (32,000) P 218,000 Instruction: Perform a vertical analysis on the financial statements of Cabbage Company. Convert all income statement accounts to common units, using net sales as the base. Use the format provided. Net sales Cost of goods sold Gross profit Selling expenses Cabbage Company Income Statement For the years ended December 31, 2014 and 2013 Administrative expenses Total operating expenses Income before income tax Income tax Net income Amount 2014 P 800,000 (350,000) P 450,000 (P150,000) (37,000) (P187,000) P 263,000 (40,000) P 223,000 Percent Amount 2013 P 700,000 (320,000) P 380,000 (P110,000) (20,000) (P130,000) P 250,000 (32,000) P 218,000 Percent
Step by Step Solution
There are 3 Steps involved in it
Step: 1
In the case of the horizontal analysis for SPINACH Company the percentage changes in current assets ...
Get Instant Access to Expert-Tailored Solutions
See step-by-step solutions with expert insights and AI powered tools for academic success
Step: 2

Step: 3

Ace Your Homework with AI
Get the answers you need in no time with our AI-driven, step-by-step assistance
Get Started


