I just wanted to see if i got the right answers so I can submit the work.
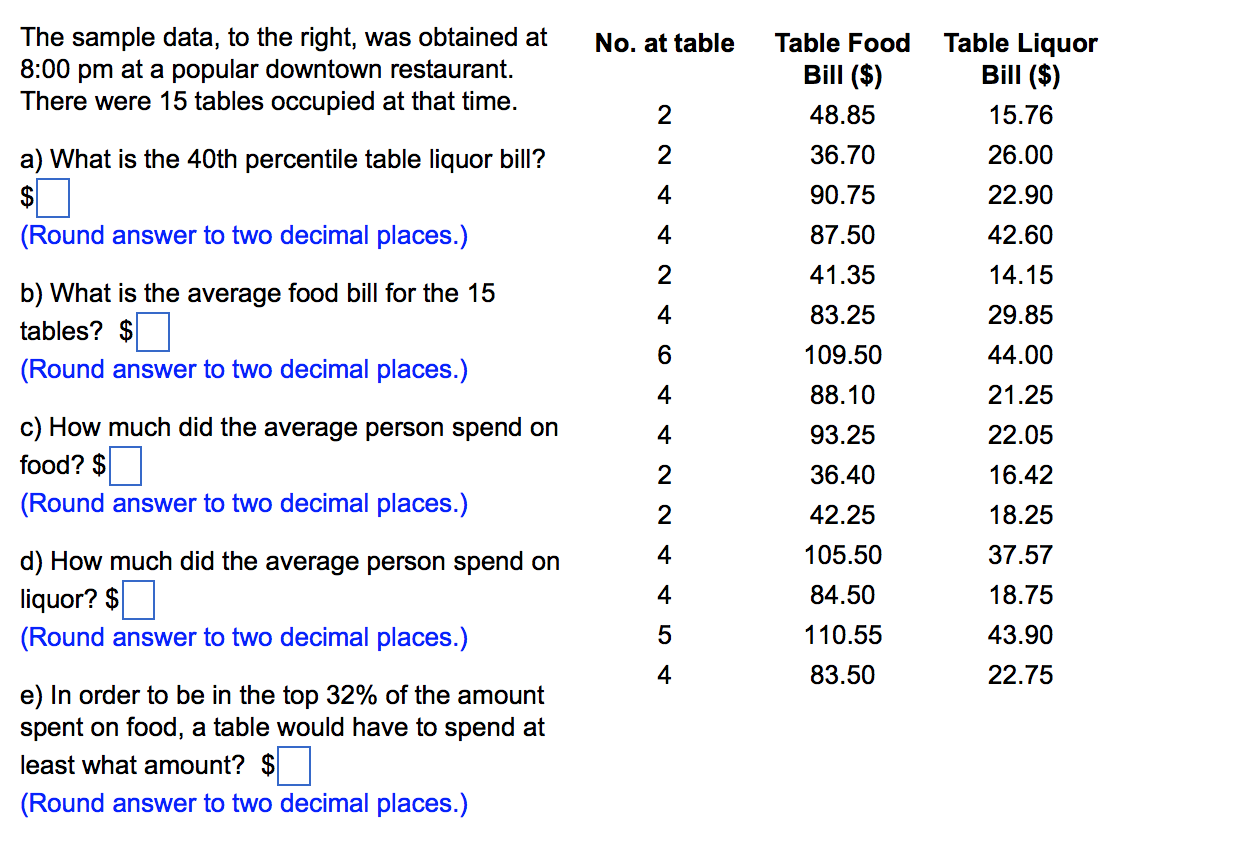
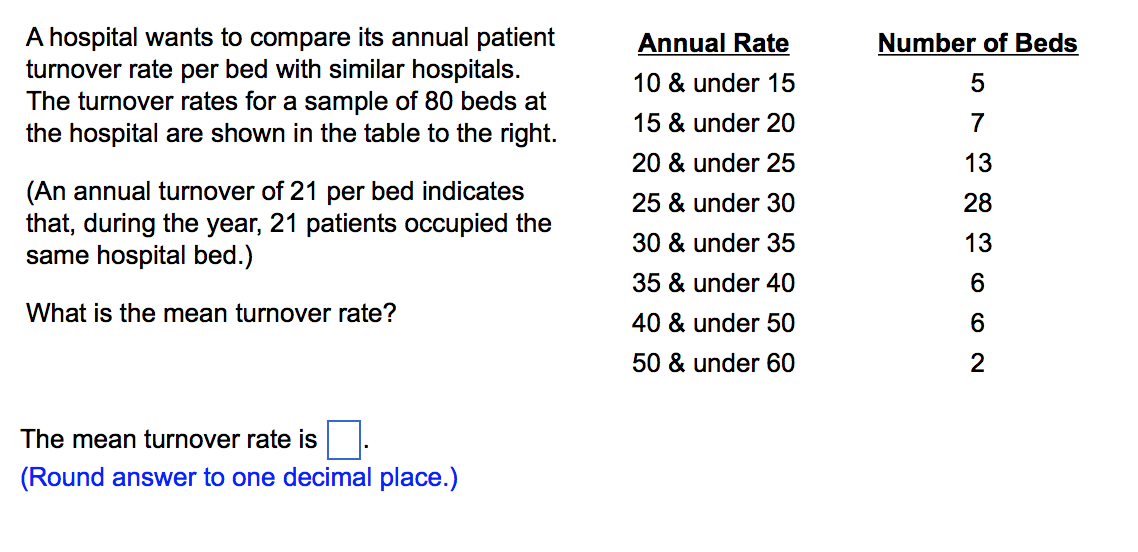
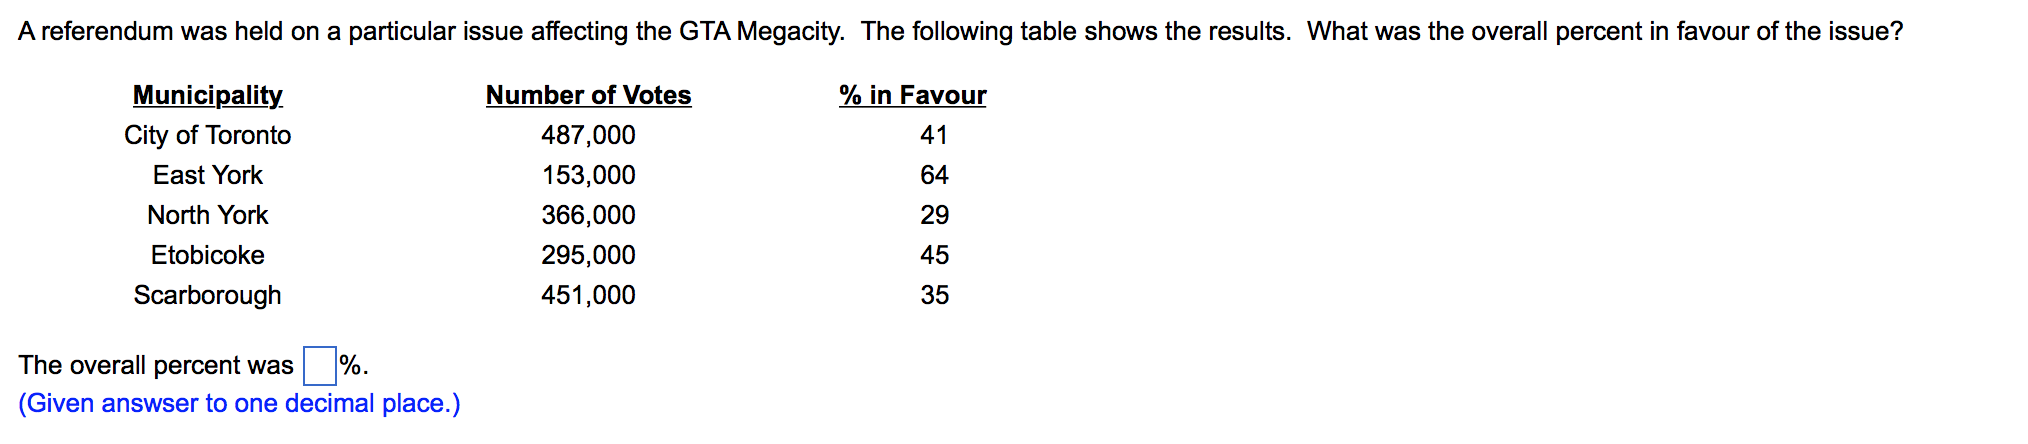
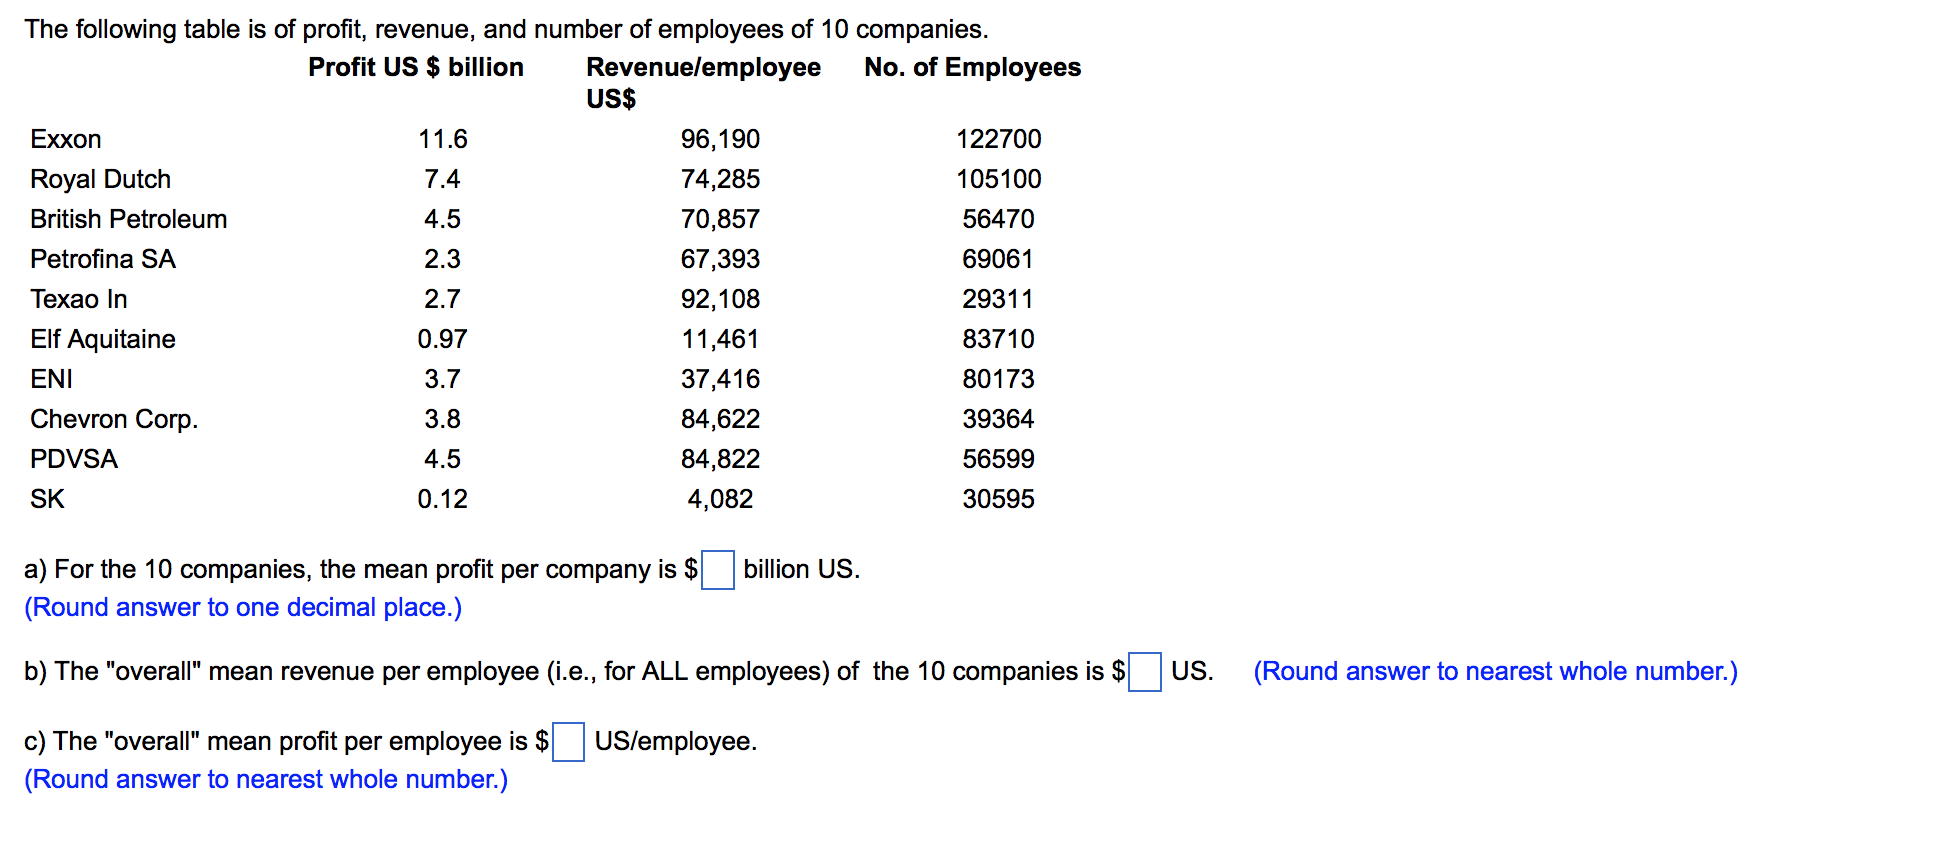
The sample data, to the right, was obtained at 8:00 pm at a popular downtown restaurant. There were 15 tables occupied at that time. a) What is the 40th percentile table liquor bill? $D (Round answer to two decimal places.) b) What is the average food bill for the 15 tables? $|:| (Round answer to two decimal places.) 0) How much did the average person spend on food? $|:| (Round answer to two decimal places.) d) How much did the average person spend on liquor? $|:| (Round answer to two decimal places.) e) In order to be in the top 32% of the amount spent on food, a table would have to spend at least what amount? $|:| (Round answer to two decimal places.) No. at table #mthNhhm--Nh-ILNN Table Food Bill ($) 48.85 36.70 90.75 87.50 41 .35 83.25 1 09.50 88.10 93.25 36.40 42.25 1 05.50 84.50 1 10.55 83.50 Table Liquor Bill ($) 15.76 26.00 22.90 42.60 14.15 29.85 44.00 21.25 22.05 16.42 18.25 37.57 18.75 43.90 22.75 A hospital wants to compare its annual patient turnover rate per bed with similar hospitals. The turnover rates for a sample of 80 beds at the hospital are shown in the table to the right. (An annual tumover of 21 per bed indicates that, during the year, 21 patients occupied the same hospital bed.) What is the mean turnover rate? The mean turnover rate is D. (Round answer to one decimal place.) Annual Rate 10 & under 15 15 & under 20 20 & under 25 25 & under 30 30 & under 35 35 & under 40 40 & under 50 50 & under 60 Number of Beds 5 7 13 28 13 6 6 2 Areferendum was held on a particular issue affecting the GTA Megacity. The following table shows the results. What was the overall percent in favour of the issue? Municipa_lity_ Number of Votes % in Favour City of Toronto 487,000 41 East York 153,000 64 North York 366,000 29 Etobicoke 295,000 45 Scarborough 451,000 35 The overall percent was D%. (Given answser to one decimal place.) The following table is of prot, revenue, and number of employees of 10 companies. Profit US S billion Revenuelemployee No. of Employees US$ Exxon 11.6 96,190 122700 Royal Dutch 7.4 74,285 105100 British Petroleum 4.5 70,857 56470 Petrona SA 2.3 67,393 69061 Texao In 2.7 92,108 29311 Elf Aquitaine 0.97 11,461 83710 ENI 3.7 37,416 80173 Chevron Corp. 3.8 84,622 39364 PDVSA 4.5 84,822 56599 SK 0.12 4,082 30595 a) For the 10 companies, the mean prot per company is $ (Round answer to one decimal place.) billion US. b) The "overall" mean revenue per employee (i.e., for ALL employees) of the 10 companies is $ c) The "overall" mean prot per employee is $ US/employee. (Round answer to nearest whole number.) US. (Round answer to nearest whole number.) Using the data on the right, nd the average Avg. SaleslStore sales of the toy store chains (in $1000)? Chain # of Stores (5 000) The average sales is $|:|. TYS R US 147 7'234 Chlld World 74 3,585 (round answer to the nearest whole number.) Kaybee 366 502 Lionel 51 3,231