Answered step by step
Verified Expert Solution
Question
1 Approved Answer
i nedd help please. work mode: This show what is correct or incorrect for the work you have completed so te does not necate completion
i nedd help please. 


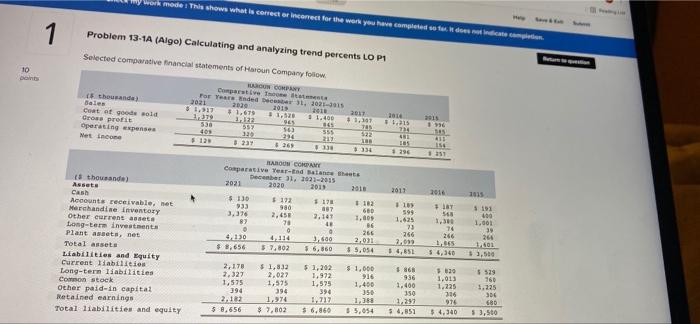
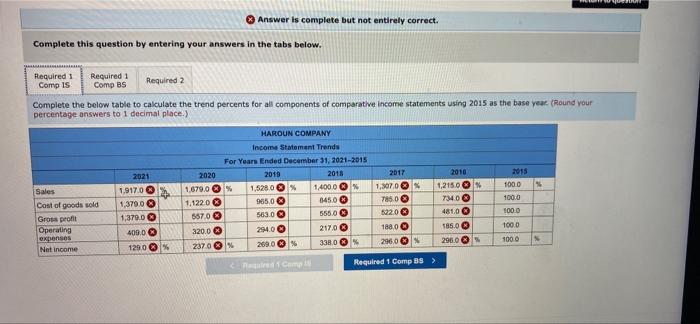
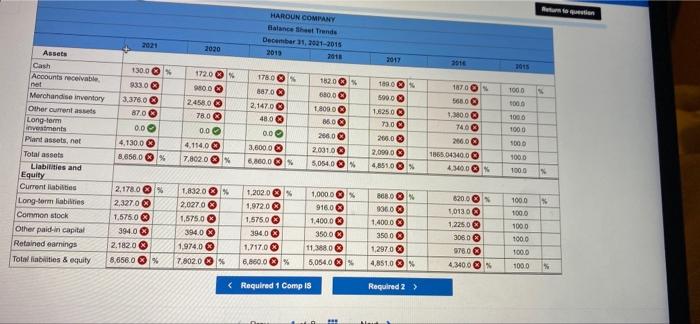
work mode: This show what is correct or incorrect for the work you have completed so te does not necate completion 1 Problem 13-1A (Algo) Calculating and analyzing trend percents LOP1 10 DOND www 2014 2015 96 ) 1111 CH 411 E. 185 1296 Selected comparative financial statements of Haroun Company Follow NO thousand For Year Ended 31, 2015 Comparative Bales 2021 2010 Coat of good old $1,917 2019 #1,679 11.50 2017 11.400 Gros profit 1,197 350 145 Operating expenses 557 409 555 Met Income 214 522 $123 211 3237 13 26 334 HARON CORDAME Comparative Year Batanes Deber 31, 2021-2015 thousande) Assets 2021 -2020 2011 Cash $ 130 Accounts receivable.net 172 #178 182 933 Merchandise Inventory 980 187 3,376 2.458 2,147 1,00 Other current assete 87 70 86 Long-term investments 265 Plant assets, net 4,170 4.110 3.500 2.021 Total assets $8.656 $7.802 55.860 $ 5,054 Liabilities and Equity Current abilities 2.178 $1,332 $ 1,202 $ 1.000 Long-term liabilities 2.327 2.022 1.972 916 Con stock 1,575 1.575 1,575 1.450 Other paid-in capital 394 394 394 356 Retained earnings 2.183 1.274 1.212 1,388 Total liabilities and equity 5 8.656 $ 7,802 $6,860 $ 5,054 2011 2011 2016 LET 099 ** 1109 599 1.625 73 26000 2015 5193 100 1,001 39 264 1601 $ 3,50 56 1,300 74 266 1,265 o 92 09 1581 981 620 1.013 1.225 $ 529 760 1.225 936 1.400 350 1.297 56,851 900 906 974 5.4.340 680 $ 3,500 Answer is complete but not entirely correct. Complete this question by entering your answers in the tabs below. Required Comp IS Required 1 Comp BS Required 2 Complete the below table to calculate the trend percents for all components of comparative income statements using 2015 as the base your (Round your percentage answers to 1 decimal place) 2 2021 1.917.0 1,379,0 1,370.03 400.0 1290 % HAROUN COMPANY Income Statement Trends For Years Ended December 31, 2021-2015 2020 2010 2018 1.679.0 % 1.5280 % 1,400.0 % 1,12203 9850 145.00 5570 563.0 555.0 320.0 294.0 217.00 23703 2000 338.0 % 2015 1000 100.0 2017 1,3070 7850 5220 1880 2010 1,215.00 7340 481,03 Sales Cost of goods sold Gross profit Operating expenses Net income 1000 585.0 100.0 2960 2900 1000 Camp Required 1 Comp 83 > HAROUN COMPANY 2021 December 11, 2021-2015 2013 2018 Assets 2020 2017 130.0 1915 1720 933.03 1800 59000 TOOS 1780 8870 2.147.00 480 3.375.0 500 870 900 24580 78.00 0.00 4.114,03 7,802 0 1820 S 880,00 18000 8500 268.00 2.0010 5,0540 % 1000 1000 100.0 1000 0.0 4.130.00 8.656.0 % Cash Accounts receivable net Merchandise inventory Other current assets Long-term investments Plant assets.net Total assets Liabilities and Equity Current liabilis Long-term abilities Common stock Other paid in capital Retained earnings Tot liabilities & equity 1.6250 7300 200.00 2.000.00 4.65100 0.0 3,000.00 6.800.0 100 9.300 740 200.00 1068.04340.00 43000 100.0 + 1000 1000 2,178.0% 2,3270 1,575.03 3940 2.182.0 8,656.0 % 1.832.00 2,027 03 1,575.0 394.03 1,974.0 7.802.0 % 1.2020 1,9720 1.575.0 394.0 1.7170 6,850.0 % 1,000.00 % 9160 1.400.0 350.00 11,3880 5,054.0 % 888.0 % 2060 1.400.00 3500 1,2970 4,851.03% 82000 1,013.00 1,225.00 3060 9780 4.3400 1000 1000 1000 100.0 100.0 


Step by Step Solution
There are 3 Steps involved in it
Step: 1

Get Instant Access to Expert-Tailored Solutions
See step-by-step solutions with expert insights and AI powered tools for academic success
Step: 2

Step: 3

Ace Your Homework with AI
Get the answers you need in no time with our AI-driven, step-by-step assistance
Get Started


