

Answered step by step
Verified Expert Solution
Question
1 Approved Answer
i need 100% correct answer in matlab The requirements are as follows: 1) Divide the plotting window into left and right two sub areas 2)
i need 100% correct answer in matlab 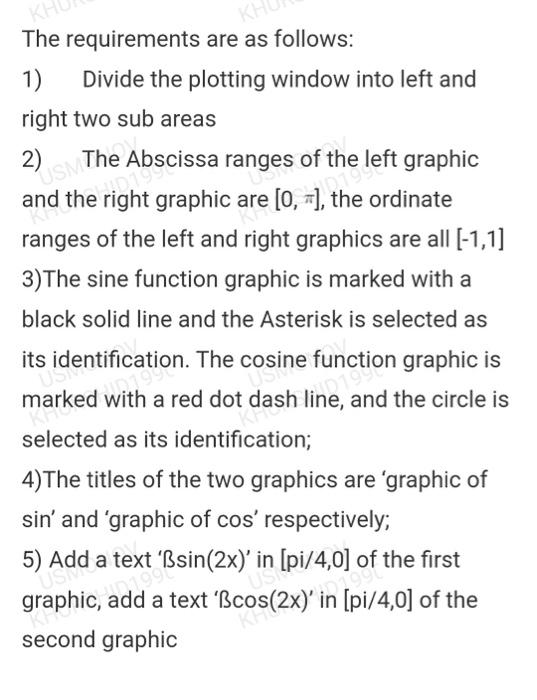
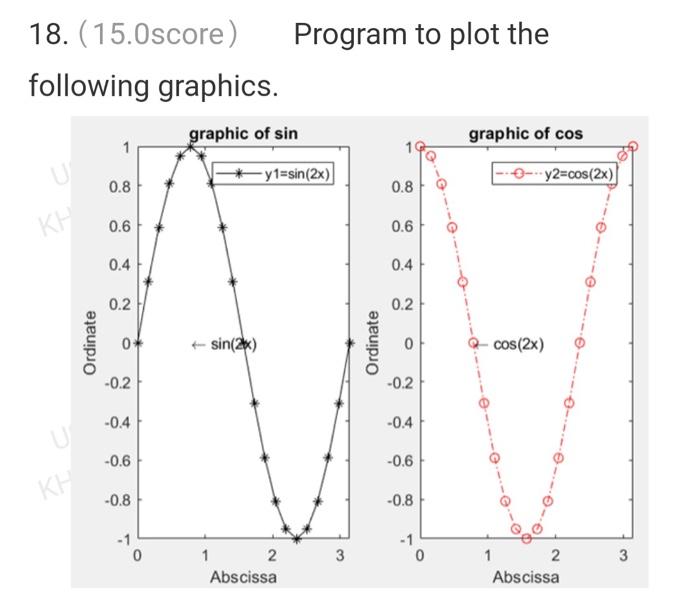
The requirements are as follows: 1) Divide the plotting window into left and right two sub areas 2) The Abscissa ranges of the left graphic and the right graphic are [0,], the ordinate ranges of the left and right graphics are all [1,1] 3)The sine function graphic is marked with a black solid line and the Asterisk is selected as its identification. The cosine function graphic is marked with a red dot dash line, and the circle is selected as its identification; 4)The titles of the two graphics are 'graphic of sin' and 'graphic of cos' respectively; 5) Add a text ' sin(2x) ' in [pi/4,0] of the first graphic, add a text ' Bcos(2x) ' in [pi/4,0] of the second graphic 18. (15.0score) Program to plot the following graphics Step by Step Solution
There are 3 Steps involved in it
Step: 1

Get Instant Access to Expert-Tailored Solutions
See step-by-step solutions with expert insights and AI powered tools for academic success
Step: 2

Step: 3
Ace Your Homework with AI
Get the answers you need in no time with our AI-driven, step-by-step assistance
Get Started
MFDBS 91 3rd Symposium On Mathematical Fundamentals Of Database And Knowledge Base Systems Rostock Germany May 6 9 1991
Authors: Bernhard Thalheim ,Janos Demetrovics ,Hans-Detlef Gerhardt
1991st Edition
3540540091, 978-3540540090