

Question
I need a C program to print 2 tables of temperature values converting Celsius to Fahrenheit. The first table should display the following columns: -Temperature
I need a C program to print 2 tables of temperature values converting Celsius to Fahrenheit.
The first table should display the following columns:
-Temperature in Celsius
-Temperature in Fahrenheit
-Several columns of Temperature in Fahrenheit which include Wind Chill factor. One column for each wind speed value starting @5mph up to 40mph in increments of 5mph.
The second table should display the following columns:
-Temperature in Celsius
-Temperature in Fahrenheit
-Several columns of Temperature in Fahrenheit which include Heat Index factor. One column for each relative humidity percentage starting at 40% up to 100% in increments of 10.
The headings for each column must also be printed i.e. Celsius, Fahrenheit, Wind speed (or Heat index) value. If any temperature value is not valid for either Wind Chill calculation or Heat Index calculation print a X in that column.
Formulas: Windchill Index:
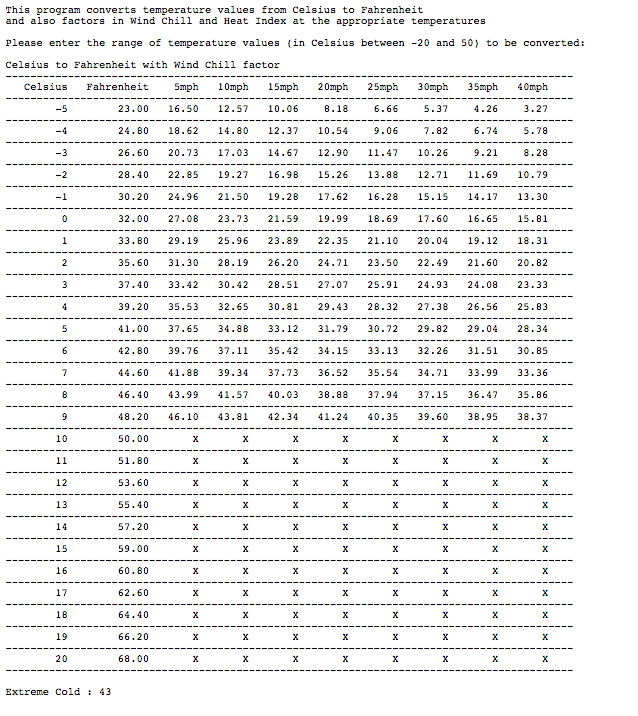
-Wind chill temperatures are valid for temperatures up to 50 degrees Fahrenheit only and when the wind speed is 5 miles or more.
Heat Index:
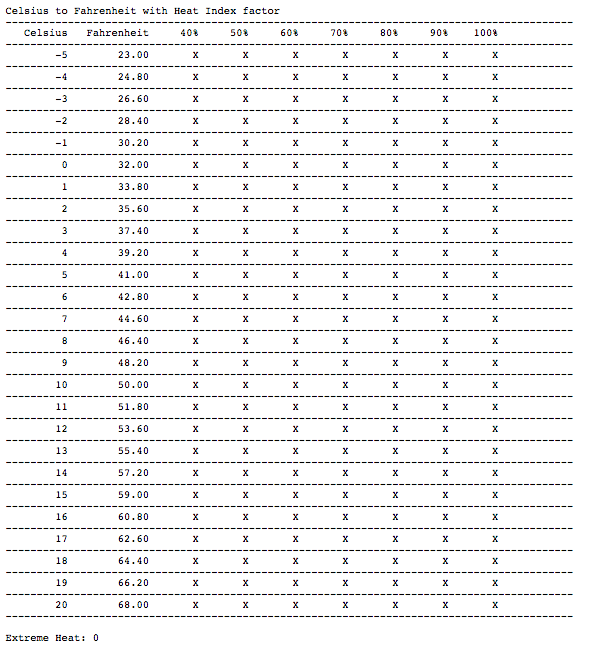
-Heat index formula is valid only when the temperature is 80 deg Fahrenheit or above and when the relative humidity is 40% or more.
Functions: Function Compute_Wind_Chill () Input arguments: Integers for range of Celsius temperature values (1 Input argument for starting Celsius value, 1 Input argument for ending Celsius value) Output arguments: None Function Return value: Integer containing number of Fahrenheit values below 20 degrees. 1. This function converts temperature from Celsius to Fahrenheit for the range of temperatures provided in steps of 1 degree increments. 2. The Table should show the original Celsius and the computed Fahrenheit temperature as the first 2 columns and then additional columns for Wind Speeds from 5mph to 40 mph in increments of 5. The Fahrenheit temperature for each wind speed with Wind Chill factor must be printed under the particular Wind Speed column. 3. At the end, function should return count of temperature values less than 20.
Function Compute_Heat_Index () Input arguments: Integers for range of Celsius temperature values (1 Input argument for starting Celsius value, 1 Input argument for ending Celsius value) Output arguments: None Function Return value: Integer containing number of Fahrenheit values above 100 degrees. 1. This function converts temperature from Celsius to Fahrenheit for the range of temperatures provided in steps of 1 degree increments. 2. The table should show the original Celsius and the computed Fahrenheit temperature as the first 2 columns and additional columns for Relative Humidity from 40% to 100% in increments of 10. The Fahrenheit temperature for each relative humidity with Heat Index factor must be printed under the particular Relative Humidity column. 3. At the end the function should return count of temperature values greater than 100.
For both computations irrelevant columns should contain a X (i.e. if the initial Fahrenheit temperatures are greater than 50 for Wind Chill and less than 80 for Heat Index)
You need to use a Nested FOR statement to calculate and print values for each table.
The Main Function should display some information to the user as to how the program works. It should take input from the user for specifying the range of values (double), if the range is outside of -20 to 50 an error message should be displayed and the user must be prompted to enter new values. The program does not need a loop to keep gathering new inputs from the user if a correct range of values are entered. If a valid range is input by the user, it calls the functions Compute_Wind_Chill() and Compute_Heat_Index() to compute and print the two tables of values. After returning from each function, the main() function prints information about the total number of extreme temperature values (i.e. totals of wind chill less than 20 and totals of heat index above 100).
Output Example: if the first inputs are -5 and 20
The first table should look like this:
And the second table should look like this:
Step by Step Solution
There are 3 Steps involved in it
Step: 1

Get Instant Access to Expert-Tailored Solutions
See step-by-step solutions with expert insights and AI powered tools for academic success
Step: 2

Step: 3
Ace Your Homework with AI
Get the answers you need in no time with our AI-driven, step-by-step assistance
Get Started
Graph Databases
Authors: Ian Robinson, Jim Webber, Emil Eifrem
1st Edition
1449356265, 978-1449356262