

Answered step by step
Verified Expert Solution
Question
1 Approved Answer
i need a financial ratio analysis of BEST BIY for the past 5 years as well as their competitors financial ratio of the past 5
i need a financial ratio analysis of BEST BIY for the past 5 years as well as their competitors financial ratio of the past 5 years 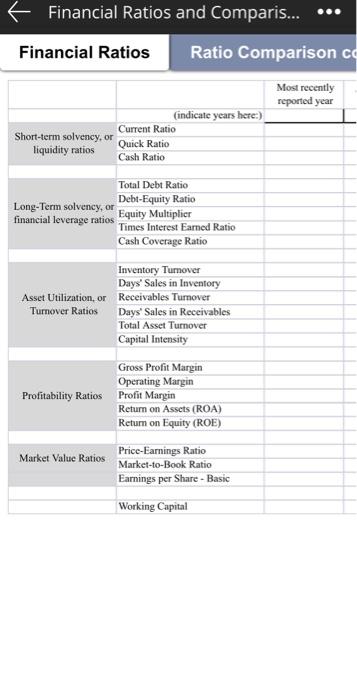
and a one page well written summary of BEST BUY key performance indicators to paint a picture of their financial health
also indicate what broad strategies their financial position and trajectory suggests for them
MOST INFORMATION ABOUT THEIR FINANCIAL RATIO CAN BE FOUND ON MERGENT ONLINE AND MERGENT INTELLECT
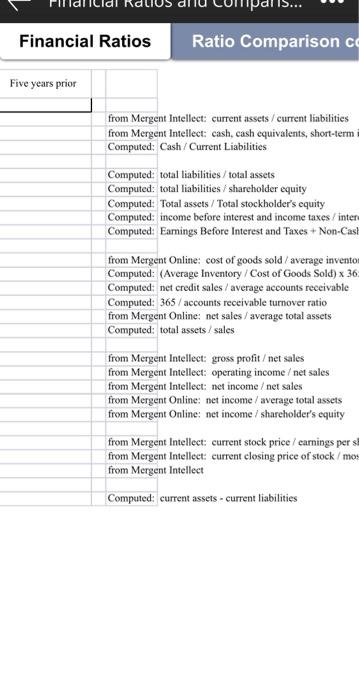
first 2 pictures are for BEST Buy FINANCIAL RATIO
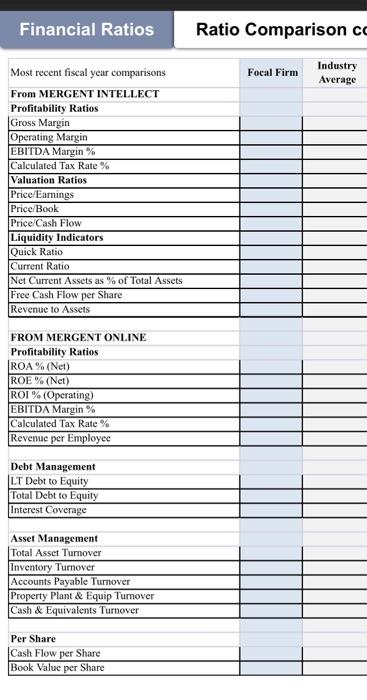
seconf 2 pictures are their competitors financial ratio
.
Financial Ratios and Comparis... Financial Ratios Ratio Comparison cc Most recently reported year (indicate years here:) Short-term solvency, or Current Ratio liquidity ratios Quick Ratio Cash Ratio Total Debt Ratio Long-Term solvency, or Debt-Equity Ratio financial leverage ratios Equity Multiplier Times Interest Earned Ratio Cash Coverage Ratio Inventory Turnover Days' Sales in Inventory Asset Utilization, or Receivables Tumover Turnover Ratios Days' Sales in Receivables Total Asset Turnover Capital Intensity Gross Profit Margin Operating Margin Profitability Ratios Profit Margin Return on Assets (ROA) Return on Equity (ROE) Market Value Ratios Price-Earnings Ratio Market-to-Book Ratio Earnings per Share - Basic Working Capital Financial Ratios Ratio Comparison co Five years prior from Mergent Intellect current assets / current liabilities from Mergent Intellect: cash, cash equivalents, short-term Computed: Cash/Current Liabilities Computed: total liabilities/total assets Computed: total liabilities / shareholder equity Computed: Total assets / Total stockholder's equity Computed: income before interest and income taxes/inter Computed: Earnings Before Interest and Taxes + Non-Cash from Mergent Online: cost of goods sold / average invento Computed: (Average Inventory / Cost of Goods Sold) x 36 Computed; net credit sales / average accounts receivable Computed: 365 / accounts receivable turnover ratio from Mergent Online: net sales/ average total assets Computed: total assets/ sales from Mergent Intellect: gross profitet sales from Mergent Intellect: operating income / net sales from Mergent Intellect: net income / net sales from Mergent Online: net income / average total assets from Mergent Online: net income / shareholder's equity from Mergent Intellect: current stock price / carnings per s from Mergent Intellect: current closing price of stock/mos from Mergent Intellect Computed current assets - current liabilities Financial Ratios Ratio Comparison cc Focal Firm Industry Average Most recent fiscal year comparisons From MERGENT INTELLECT Profitability Ratios Gross Margin Operating Margin EBITDA Margin% Calculated Tax Rate % Valuation Ratios Price/Earnings Price/Book Price/Cash Flow Liquidity Indicators Quick Ratio Current Ratio Net Current Assets as % of Total Assets Free Cash Flow per Share Revenue to Assets FROM MERGENT ONLINE Profitability Ratios ROA % (Net) ROE % (Net) ROI % (Operating) EBITDA Margin % Calculated Tax Rate% Revenue per Employee Debt Management LT Debt to Equity Total Debt to Equity Interest Coverage Asset Management Total Asset Turnover Inventory Turnover Accounts Payable Turnover Property Plant & Equip Turnover Cash & Equivalents Turnover Per Share Cash Flow per Share Book Value per Share Financial Ratios and Comparis... ** Financial Ratios Ratio Comparison cc stry age Competitor 1 Competitor 2 Competitor 3 Competitor 4 Competitor 5 Financial Ratios and Comparis... Financial Ratios Ratio Comparison cc Most recently reported year (indicate years here:) Short-term solvency, or Current Ratio liquidity ratios Quick Ratio Cash Ratio Total Debt Ratio Long-Term solvency, or Debt-Equity Ratio financial leverage ratios Equity Multiplier Times Interest Earned Ratio Cash Coverage Ratio Inventory Turnover Days' Sales in Inventory Asset Utilization, or Receivables Tumover Turnover Ratios Days' Sales in Receivables Total Asset Turnover Capital Intensity Gross Profit Margin Operating Margin Profitability Ratios Profit Margin Return on Assets (ROA) Return on Equity (ROE) Market Value Ratios Price-Earnings Ratio Market-to-Book Ratio Earnings per Share - Basic Working Capital Financial Ratios Ratio Comparison co Five years prior from Mergent Intellect current assets / current liabilities from Mergent Intellect: cash, cash equivalents, short-term Computed: Cash/Current Liabilities Computed: total liabilities/total assets Computed: total liabilities / shareholder equity Computed: Total assets / Total stockholder's equity Computed: income before interest and income taxes/inter Computed: Earnings Before Interest and Taxes + Non-Cash from Mergent Online: cost of goods sold / average invento Computed: (Average Inventory / Cost of Goods Sold) x 36 Computed; net credit sales / average accounts receivable Computed: 365 / accounts receivable turnover ratio from Mergent Online: net sales/ average total assets Computed: total assets/ sales from Mergent Intellect: gross profitet sales from Mergent Intellect: operating income / net sales from Mergent Intellect: net income / net sales from Mergent Online: net income / average total assets from Mergent Online: net income / shareholder's equity from Mergent Intellect: current stock price / carnings per s from Mergent Intellect: current closing price of stock/mos from Mergent Intellect Computed current assets - current liabilities Financial Ratios Ratio Comparison cc Focal Firm Industry Average Most recent fiscal year comparisons From MERGENT INTELLECT Profitability Ratios Gross Margin Operating Margin EBITDA Margin% Calculated Tax Rate % Valuation Ratios Price/Earnings Price/Book Price/Cash Flow Liquidity Indicators Quick Ratio Current Ratio Net Current Assets as % of Total Assets Free Cash Flow per Share Revenue to Assets FROM MERGENT ONLINE Profitability Ratios ROA % (Net) ROE % (Net) ROI % (Operating) EBITDA Margin % Calculated Tax Rate% Revenue per Employee Debt Management LT Debt to Equity Total Debt to Equity Interest Coverage Asset Management Total Asset Turnover Inventory Turnover Accounts Payable Turnover Property Plant & Equip Turnover Cash & Equivalents Turnover Per Share Cash Flow per Share Book Value per Share Financial Ratios and Comparis... ** Financial Ratios Ratio Comparison cc stry age Competitor 1 Competitor 2 Competitor 3 Competitor 4 Competitor 5 Step by Step Solution
There are 3 Steps involved in it
Step: 1

Get Instant Access to Expert-Tailored Solutions
See step-by-step solutions with expert insights and AI powered tools for academic success
Step: 2

Step: 3
Ace Your Homework with AI
Get the answers you need in no time with our AI-driven, step-by-step assistance
Get Started
Financial Accounting Tools For Business Decision Making
Authors: Paul D. Kimmel
4th Canadian Edition
0470155353, 978-0470155356