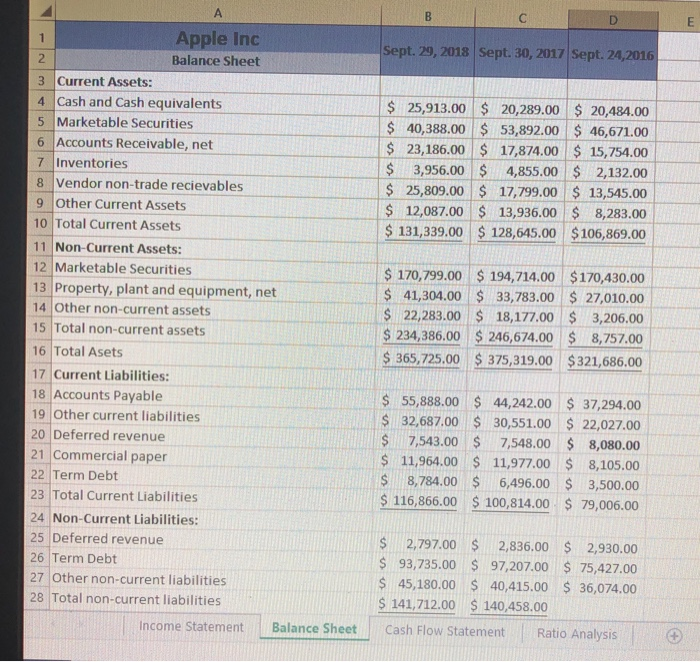
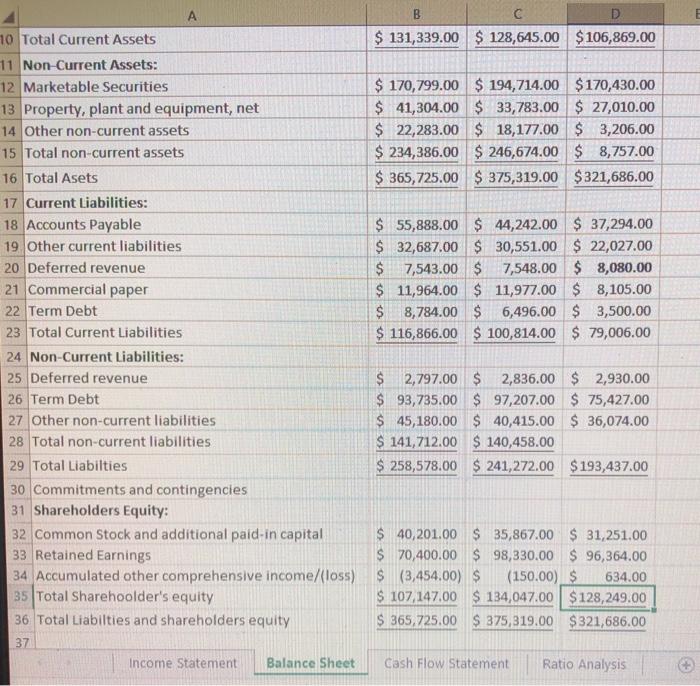
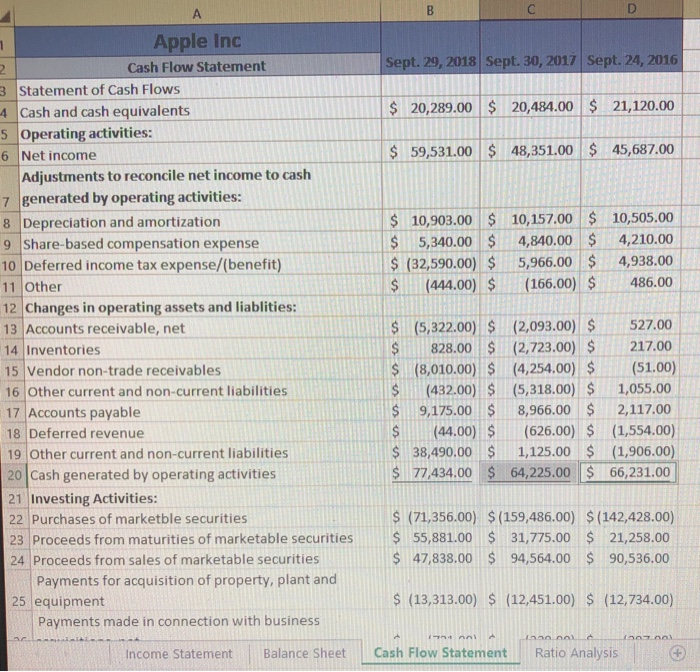
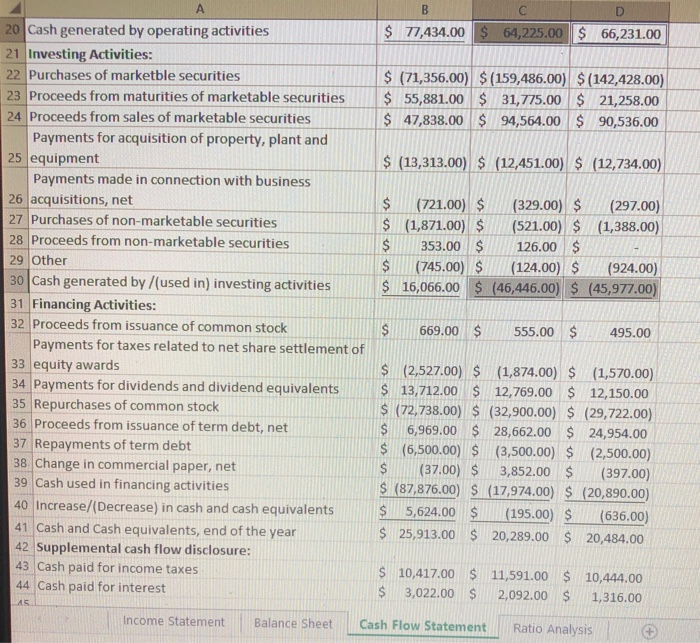
I need a ratio analysis for an excel spreadsheet
Financial analysis:
-also need dollar change between each year
-need percent change between each year
-calculate common size percents
i.use total assets as the base amount
ii.uses sales as the base amount for the income statement
iii. no common size percentages must be calculated for statement of cash flows
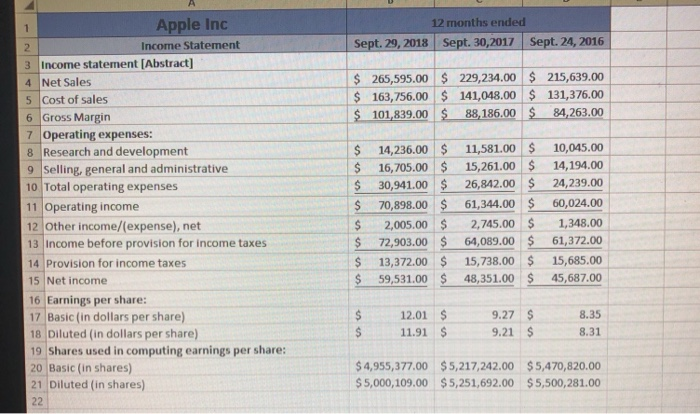
12 months ended Apple Inc Income Statement Sept.29, 2018 Sept. 30,2017 Sept. 24, 2016 3 Income statement [Abstract] 4 Net Sales 5 Cost of sales 6 Gross Margin 265,595.00 229,234.00 215,639.00 $163,756.00141,048.00 131,376.00 101,839.00 88,186.00S 84,263.00 Operating expenses: 8 Research and development 9Selling, general and administrative 10 Total operating expenses 11 Operating income 12 Other income/(expense), net 13 Income before provision for income taxes 14 Provision for income taxes 15 Net income 16 Earnings per share: 17 Basic (in dollars per share) 18 Diluted (in dollars per share) 19 Shares used in computing earnings per share: 20 Basic (in shares) 21 Diluted (in shares) $ 14,236.0011,581.00 S 10,045.00 S 16,705.00 15,261.00 14,194.00 26,842.00 24,239.00 61,344.00 60,024.00 $ 30,941.00 $ 70,898.00 $ 2,005.00$2,745.001,348.00 $72,903.00 $ 64,089.00 61,372.00 s 13,372.00 15,738.00 15,685.00 $ 59,531.00 48,351.00$45,687.00 $12.01 $ 11.91 $ 9.27 $ 9.21 $ 8.35 8.31 4,955,377.00 $5,217,242.00 $5,470,820.00 5,000,109.00 $5,251,692.00 $5,500,281.00 Apple Inc Balance Sheet Sept. 29, 2018 | Sept. 30, 2017 | Sept. 24,2016 2 3 Current Assets: 4 Cash and Cash equivalents 5 Marketable Securities $ 25,913.00 20,289.00 20,484.00 $40,388.00 53,892.00 46,671.00 23,186.00 17,874.00 15,754.00 3,956.00 855.00 2,132.00 $ 25,809.00 $ 17,799.00 $ 13,545.00 12,087.00 13,936.00 8,283.00 $ 131,339.00 128,645.00 $106,869.00 6 Accounts Receivable, net 7 Inventories 8 Vendor non-trade recievables 9 Other Current Assets 10 Total Current Assets 11 Non-Current Assets: 12 Marketable Securities S 170,799.00 $ 194,714.00 $170,430.00 $41,304.00 $ 33,783.00 $ 27,010.00 $ 22,283.00 18,177.00$ 3,206.00 234,36.00 246,674.00 $ 8,757.00 36,725,00 375,319.00 $321,686.00 13 Property, plant and equipment, net 14 Other non-current assets 15 Total non-current assets 16 Total Asets 17 Current Liabilities: 18 Accounts Payable 19 Other current liabilities 20 Deferred revenue 21 Commercial paper 22 Term Debt 23 Total Current Liabilities 24 Non-Current Liabilities: 25 Deferred revenue 26 Term Debt 27 Other non-current liabilities 28 Total non-current liabilities $ 55,888.00 $ 44,242.00 37,294.00 $ 32,687.00 30,551.00 $22,027.00 $7,543.00$ 7,548.00 $ 8,080.00 s 11,964.00 S 11,977.00 8,105.00 $ 8,784.00 6,496.00 $3,500.00 $ 116,866.00 $ 100,814.00 S 79,006.00 $ 2,797.00 S 2,836.00 2,930.00 $ 93,735.00 $ 97,207.00 $ 75,427.00 $ 45,180.00 S 40,415.00 $ 36,074.00 S 141,712.00 S 140,458.00 income Statement Balance Sheet Cash Flow Statement Ratio Analysis $131,339.00 128,645.00 $106,869.00 10 Total Current Assets 11 Non-Current Assets: 12 Marketable Securities 13 Property, plant and equipment, net 14 Other non-current assets 15 Total non-current assets 16 Total Asets 17 Current Liabilities: 18 Accounts Payable 19 Other current liabilities 20 Deferred revenue 21 Commercial paper 22 Term Debt 23 Total Current Liabilities 24 Non-Current Liabilities: 25 Deferred revenue 26 Term Debt 27 Other non-current liabilities 28 Total non-current liabilities 29 Total Liabilties $170,799.00 194,714.00 $170,430.00 $41,304.00 33,783.00 27,010.00 $ 22,283.00 18,177.00 3,206.00 $234,386.00 246,674.00 8,757.00 365,725.00 375,319.00 $321,686.00 44,242.00 37,294.00 32,687.00 30,551.00 $ 22,027.00 $7,543.00 7,548.00 8,080.00 $ 11,964.00 $ 11,977.00 8,105.00 $8,784.00 6,496.00 3,500.00 $ 116,866.00 100,814.00 $ 79,006.00 S55,888.0 $2,797.00 2,836.00 2,930.00 93,735.00 $ 97,207.00 75,427.00 $ 45,180.00 $ 40,415.00$ 36,074.00 S 141,712.00 $ 140,458.00 $ 258,578.00 $241,272.00 $193,437.00 30 Commitments and contingencies 31 Shareholders Equity: 32 Common Stock and additional paid-in capital 33 Retained Earnings 34 Accumulated other comprehensive income/(loss) 35 Total Sharehoolder's equity 36 Total Liabilties and shareholders equity 37 $40,201.00 $35,867.00 31,251.00 $70,400.00 $ 98,330.00 $ 96,364.00 (150.00) $634.00 S 107 14700 134,04700 $128,249.00 365,725.00 S 375,319.00 $321,686.00 $ (3,454.00) $ Income Statement Balance Sheet Cash Flow StatementRatio Analysis Apple Inc Cash Flow Statement Sept. 29, 2018 Sept. 30, 2017 Sept. 24, 2016 $20,289.00 20,484.00 21,120.00 $59,531.00 $ 48,351.00 45,687.00 3 Statement of Cash Flows 4 Cash and cash equivalents s Operating activities 6 Net income Adjustments to reconcile net income to cash 7 generated by operating activities 8 Depreciation and amortization 10,903.00 10,157.00 10,505.00 $5,340.00 4,840.004,210.00 (32,590.005,966.00 4,938.00 9 Share-based compensation expense 10 Deferred income tax expense/(benefit) 11 Other 12 Changes in operating assets and liablities: 13 Accounts receivable, net S (444.00)166.00) 4 486.00 14 Inventories 15 Vendor non-trade receivables 16 Other current and non-current liabilities 17 Accounts payable 18 Deferred revenue S (5,322.00(2,093.00) S 527.00 $828.00 (2,723.00) 217.00 $ (8,010.00)S (4,254.00) (S1.00) $(432.00) S (5,318.00) S 1,055.00 S9,175.00 8,966.00 2,117.00 (44.00) S (626.00) $ (1,554.00) $ 38,490.00 $ 1,125.00 (1,906.00) 77,434.00 64,225.00 66,231.00 19 Other current and non-current liabilities 20 Cash generated by operating activities 21 Investing Activities: 22 Purchases of marketble securities 23 Proceeds from maturities of marketable securities$ 55,881.00 $ 31,775.00 $21,258.00 24 Proceeds from sales of marketable securities S (71,356.00) $(159,486.00) $(142,428.00) $47,838.00 $ 94,564.00 $ 90,536.00 S (13,313.00) S (12,451.00) $ (12,734.00) Payments for acquisition of property, plant and 25 equipment Payments made in connection with business Income Statement Balance Sheet Cash Flow Statement Ratio Analysis Cash generated by operating activities $ 77,434.00 00 $ 64,225.00 S 66,231.00 Investing Activities: 22 Purchases of marketble securities 23 Proceeds from maturities of marketable securities $ (71,356.00) $ (159,486.00 (142,428.00) 55,881.00 31,775.00 $ 21,258.00 $ 47,838.00 94,564.00 90,536.00 Proceeds from sales of marketable securities Payments for acquisition of property, plant and 25 equipment (13,313.00) S (12,451.00)(12,734.00) Payments made in connection with business 26 acquisitions, net 27 Purchases of non-marketable securities 28 Proceeds from non-marketable securities 29 Other 30 Cash generated by /(used in) investing activitiesS 31 Financing Activities: 32 Proceeds from issuance of common stock $(721.00)(329.00)(297.00) (1,871.00)$(521.00) $ (1,388.00) $353.00 126.00 (745.00)124.00)(924.00) 16,066.00 S (46,446.00) $ (45,977.00) S669.00 555.00495.00 Payments for taxes related to net share settlement of 33 equity awards 34 Payments for dividends and dividend equivalents $ 13.712.00 S 12,769.00 35 Repurchases of common stock 36 Proceeds from issuance of term debt, net 7 Repayments of term debt 38 Change in commercial paper, net 39 Cash used in financing activities 40 Increase/(Decrease) in cash and cash equivalents 41 Cash and Cash equivalents, end of the year 42 Supplemental cash flow disclosure: 43 Cash paid for income taxes 44 Cash paid for interest $ (2,527.00) $ (1,874.00) $ (1,570.00) 12,150.00 $ (72,738.00) S (32,900.00) $ (29,722.00) 6,969.00 $ 28,662.00 24,954.00 s (6,500.00) $ (3,500.00(2,500.00) $(37.00) $ 3,852.00 (397.00) S (87,876.00 S (17.974.00) S (20,890.00) $ 5,624.00 $ (195.00) (636.00) S 25,913.00 $20,289.00 $ 20,484.00 S 10,417.00 $ 11,591.00 $ 10,444.00 $ 3,022.00 $ 2,092.00 1,316.00 income Statement Balance Sheet Cash Flow StatementRatio Analysis 12 months ended Apple Inc Income Statement Sept.29, 2018 Sept. 30,2017 Sept. 24, 2016 3 Income statement [Abstract] 4 Net Sales 5 Cost of sales 6 Gross Margin 265,595.00 229,234.00 215,639.00 $163,756.00141,048.00 131,376.00 101,839.00 88,186.00S 84,263.00 Operating expenses: 8 Research and development 9Selling, general and administrative 10 Total operating expenses 11 Operating income 12 Other income/(expense), net 13 Income before provision for income taxes 14 Provision for income taxes 15 Net income 16 Earnings per share: 17 Basic (in dollars per share) 18 Diluted (in dollars per share) 19 Shares used in computing earnings per share: 20 Basic (in shares) 21 Diluted (in shares) $ 14,236.0011,581.00 S 10,045.00 S 16,705.00 15,261.00 14,194.00 26,842.00 24,239.00 61,344.00 60,024.00 $ 30,941.00 $ 70,898.00 $ 2,005.00$2,745.001,348.00 $72,903.00 $ 64,089.00 61,372.00 s 13,372.00 15,738.00 15,685.00 $ 59,531.00 48,351.00$45,687.00 $12.01 $ 11.91 $ 9.27 $ 9.21 $ 8.35 8.31 4,955,377.00 $5,217,242.00 $5,470,820.00 5,000,109.00 $5,251,692.00 $5,500,281.00 Apple Inc Balance Sheet Sept. 29, 2018 | Sept. 30, 2017 | Sept. 24,2016 2 3 Current Assets: 4 Cash and Cash equivalents 5 Marketable Securities $ 25,913.00 20,289.00 20,484.00 $40,388.00 53,892.00 46,671.00 23,186.00 17,874.00 15,754.00 3,956.00 855.00 2,132.00 $ 25,809.00 $ 17,799.00 $ 13,545.00 12,087.00 13,936.00 8,283.00 $ 131,339.00 128,645.00 $106,869.00 6 Accounts Receivable, net 7 Inventories 8 Vendor non-trade recievables 9 Other Current Assets 10 Total Current Assets 11 Non-Current Assets: 12 Marketable Securities S 170,799.00 $ 194,714.00 $170,430.00 $41,304.00 $ 33,783.00 $ 27,010.00 $ 22,283.00 18,177.00$ 3,206.00 234,36.00 246,674.00 $ 8,757.00 36,725,00 375,319.00 $321,686.00 13 Property, plant and equipment, net 14 Other non-current assets 15 Total non-current assets 16 Total Asets 17 Current Liabilities: 18 Accounts Payable 19 Other current liabilities 20 Deferred revenue 21 Commercial paper 22 Term Debt 23 Total Current Liabilities 24 Non-Current Liabilities: 25 Deferred revenue 26 Term Debt 27 Other non-current liabilities 28 Total non-current liabilities $ 55,888.00 $ 44,242.00 37,294.00 $ 32,687.00 30,551.00 $22,027.00 $7,543.00$ 7,548.00 $ 8,080.00 s 11,964.00 S 11,977.00 8,105.00 $ 8,784.00 6,496.00 $3,500.00 $ 116,866.00 $ 100,814.00 S 79,006.00 $ 2,797.00 S 2,836.00 2,930.00 $ 93,735.00 $ 97,207.00 $ 75,427.00 $ 45,180.00 S 40,415.00 $ 36,074.00 S 141,712.00 S 140,458.00 income Statement Balance Sheet Cash Flow Statement Ratio Analysis $131,339.00 128,645.00 $106,869.00 10 Total Current Assets 11 Non-Current Assets: 12 Marketable Securities 13 Property, plant and equipment, net 14 Other non-current assets 15 Total non-current assets 16 Total Asets 17 Current Liabilities: 18 Accounts Payable 19 Other current liabilities 20 Deferred revenue 21 Commercial paper 22 Term Debt 23 Total Current Liabilities 24 Non-Current Liabilities: 25 Deferred revenue 26 Term Debt 27 Other non-current liabilities 28 Total non-current liabilities 29 Total Liabilties $170,799.00 194,714.00 $170,430.00 $41,304.00 33,783.00 27,010.00 $ 22,283.00 18,177.00 3,206.00 $234,386.00 246,674.00 8,757.00 365,725.00 375,319.00 $321,686.00 44,242.00 37,294.00 32,687.00 30,551.00 $ 22,027.00 $7,543.00 7,548.00 8,080.00 $ 11,964.00 $ 11,977.00 8,105.00 $8,784.00 6,496.00 3,500.00 $ 116,866.00 100,814.00 $ 79,006.00 S55,888.0 $2,797.00 2,836.00 2,930.00 93,735.00 $ 97,207.00 75,427.00 $ 45,180.00 $ 40,415.00$ 36,074.00 S 141,712.00 $ 140,458.00 $ 258,578.00 $241,272.00 $193,437.00 30 Commitments and contingencies 31 Shareholders Equity: 32 Common Stock and additional paid-in capital 33 Retained Earnings 34 Accumulated other comprehensive income/(loss) 35 Total Sharehoolder's equity 36 Total Liabilties and shareholders equity 37 $40,201.00 $35,867.00 31,251.00 $70,400.00 $ 98,330.00 $ 96,364.00 (150.00) $634.00 S 107 14700 134,04700 $128,249.00 365,725.00 S 375,319.00 $321,686.00 $ (3,454.00) $ Income Statement Balance Sheet Cash Flow StatementRatio Analysis Apple Inc Cash Flow Statement Sept. 29, 2018 Sept. 30, 2017 Sept. 24, 2016 $20,289.00 20,484.00 21,120.00 $59,531.00 $ 48,351.00 45,687.00 3 Statement of Cash Flows 4 Cash and cash equivalents s Operating activities 6 Net income Adjustments to reconcile net income to cash 7 generated by operating activities 8 Depreciation and amortization 10,903.00 10,157.00 10,505.00 $5,340.00 4,840.004,210.00 (32,590.005,966.00 4,938.00 9 Share-based compensation expense 10 Deferred income tax expense/(benefit) 11 Other 12 Changes in operating assets and liablities: 13 Accounts receivable, net S (444.00)166.00) 4 486.00 14 Inventories 15 Vendor non-trade receivables 16 Other current and non-current liabilities 17 Accounts payable 18 Deferred revenue S (5,322.00(2,093.00) S 527.00 $828.00 (2,723.00) 217.00 $ (8,010.00)S (4,254.00) (S1.00) $(432.00) S (5,318.00) S 1,055.00 S9,175.00 8,966.00 2,117.00 (44.00) S (626.00) $ (1,554.00) $ 38,490.00 $ 1,125.00 (1,906.00) 77,434.00 64,225.00 66,231.00 19 Other current and non-current liabilities 20 Cash generated by operating activities 21 Investing Activities: 22 Purchases of marketble securities 23 Proceeds from maturities of marketable securities$ 55,881.00 $ 31,775.00 $21,258.00 24 Proceeds from sales of marketable securities S (71,356.00) $(159,486.00) $(142,428.00) $47,838.00 $ 94,564.00 $ 90,536.00 S (13,313.00) S (12,451.00) $ (12,734.00) Payments for acquisition of property, plant and 25 equipment Payments made in connection with business Income Statement Balance Sheet Cash Flow Statement Ratio Analysis Cash generated by operating activities $ 77,434.00 00 $ 64,225.00 S 66,231.00 Investing Activities: 22 Purchases of marketble securities 23 Proceeds from maturities of marketable securities $ (71,356.00) $ (159,486.00 (142,428.00) 55,881.00 31,775.00 $ 21,258.00 $ 47,838.00 94,564.00 90,536.00 Proceeds from sales of marketable securities Payments for acquisition of property, plant and 25 equipment (13,313.00) S (12,451.00)(12,734.00) Payments made in connection with business 26 acquisitions, net 27 Purchases of non-marketable securities 28 Proceeds from non-marketable securities 29 Other 30 Cash generated by /(used in) investing activitiesS 31 Financing Activities: 32 Proceeds from issuance of common stock $(721.00)(329.00)(297.00) (1,871.00)$(521.00) $ (1,388.00) $353.00 126.00 (745.00)124.00)(924.00) 16,066.00 S (46,446.00) $ (45,977.00) S669.00 555.00495.00 Payments for taxes related to net share settlement of 33 equity awards 34 Payments for dividends and dividend equivalents $ 13.712.00 S 12,769.00 35 Repurchases of common stock 36 Proceeds from issuance of term debt, net 7 Repayments of term debt 38 Change in commercial paper, net 39 Cash used in financing activities 40 Increase/(Decrease) in cash and cash equivalents 41 Cash and Cash equivalents, end of the year 42 Supplemental cash flow disclosure: 43 Cash paid for income taxes 44 Cash paid for interest $ (2,527.00) $ (1,874.00) $ (1,570.00) 12,150.00 $ (72,738.00) S (32,900.00) $ (29,722.00) 6,969.00 $ 28,662.00 24,954.00 s (6,500.00) $ (3,500.00(2,500.00) $(37.00) $ 3,852.00 (397.00) S (87,876.00 S (17.974.00) S (20,890.00) $ 5,624.00 $ (195.00) (636.00) S 25,913.00 $20,289.00 $ 20,484.00 S 10,417.00 $ 11,591.00 $ 10,444.00 $ 3,022.00 $ 2,092.00 1,316.00 income Statement Balance Sheet Cash Flow StatementRatio Analysis