i need all decision entries for year 11
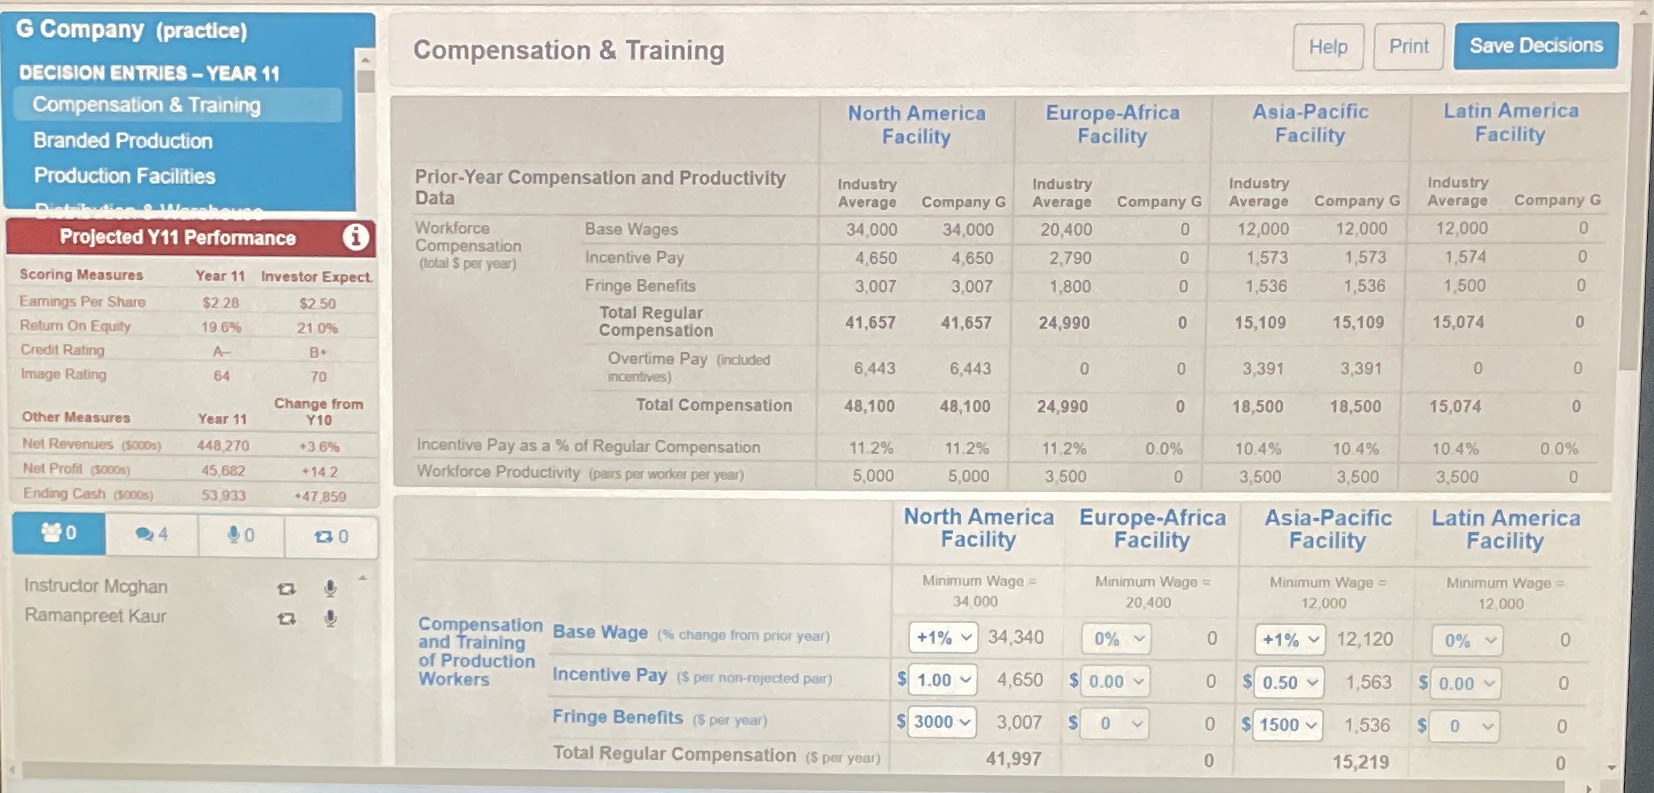
G Company (practice) Compensation & Training Help Print Save Decisions DECISION ENTRIES - YEAR 11 Compensation & Training North America Europe-Africa Asia-Pacific Latin America Branded Production Facility Facility Facility Facility Production Facilities Prior-Year Compensation and Productivity Industry Industry Industry Industry Data Average Company G Average Company G Average Company G Average Company G Workforce Base Wages 34,000 34,000 20,400 0 12,000 12,000 12,000 0 Projected Y11 Performance i Compensation Incentive Pay 4,650 4,650 2,790 O 1,573 1,573 1,574 0 (total $ per year) Scoring Measures Year 11 Investor Expect Fringe Benefits 3,007 3,007 1,800 1,536 1,536 1,500 O Earnings Per Share $2 28 $2 50 Total Regular 0 15,109 15,109 15,074 0 Return On Equity 19 6% 21 0% Compensation 41,657 41,657 24,990 Credit Rating A- B+ Overtime Pay (included 6,443 6,443 0 0 3,391 3,391 0 O Image Rating 64 70 incentives) Change from Total Compensation 48,100 48, 100 24,990 0 18,500 18,500 15,074 0 Other Measures Year 11 Y10 Net Revenues ($000s) 448.270 +3 6% Incentive Pay as a % of Regular Compensation 11.2% 11.2% 11.2% 0.0% 10.4% 10 4% 10 4% 0 0% Net Profit (30005) 45.682 +14 2 Workforce Productivity (pairs per worker per year) 5,000 5,000 3 500 0 3,500 3,500 3,500 0 Ending Cash (8000s) 53,933 +47,859 North America Europe-Africa Asia-Pacific Latin America 4 0 Facility Facility Facility Facility Minimum Wage = Minimum Wage = Minimum Wage = Minimum Wage = Instructor Moghan 34 000 20,400 12,000 12,000 Ramanpreet Kaur Compensation Base Wage ( change from prior year) 0 and Training +1% 34,340 0% +1% v 12,120 0% of Production Workers Incentive Pay (S per non-rejected pair) $ 1.00 4,650 $ 0.00 0 $ 0.50 1,563 $ 0.00 0 Fringe Benefits (S per year) $ 3000 3,007 0 0 $ 1500 1,536 $ 0 0 Total Regular Compensation ($ per year) 41,997 15,219 0