Answered step by step
Verified Expert Solution
Question
1 Approved Answer
I need ALL the steps shown through Excel, thank you. this is all the information i have for the assignment. G op A B D
I need ALL the steps shown through Excel, thank you. 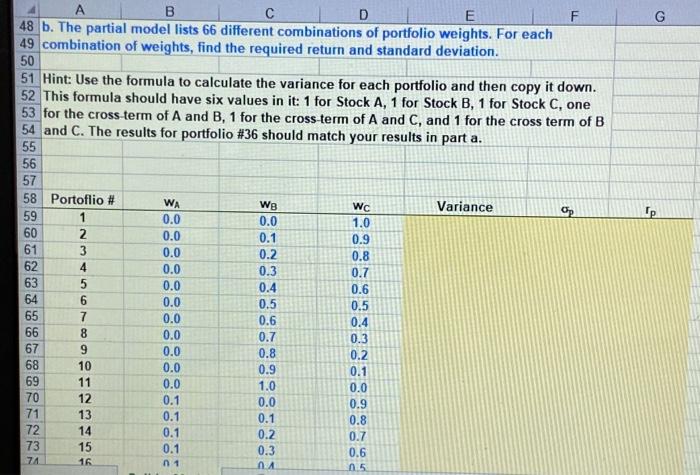
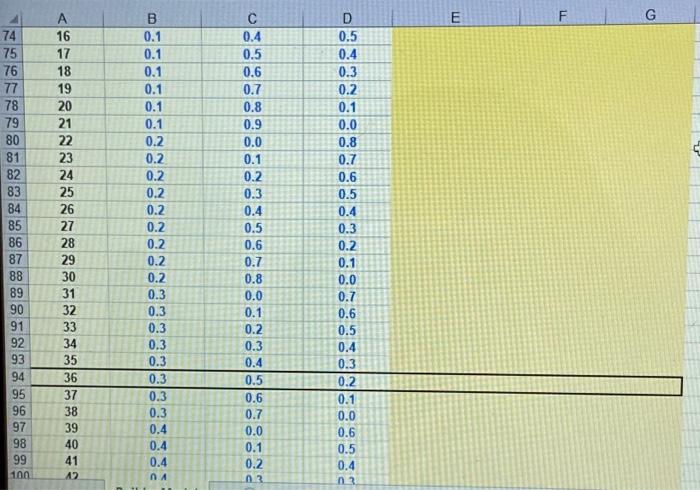
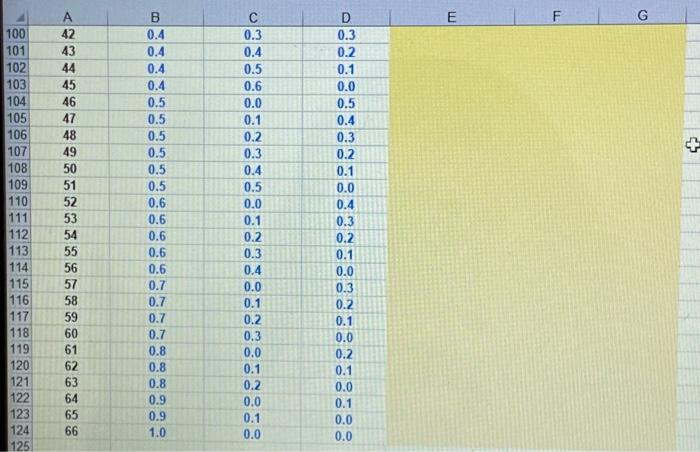
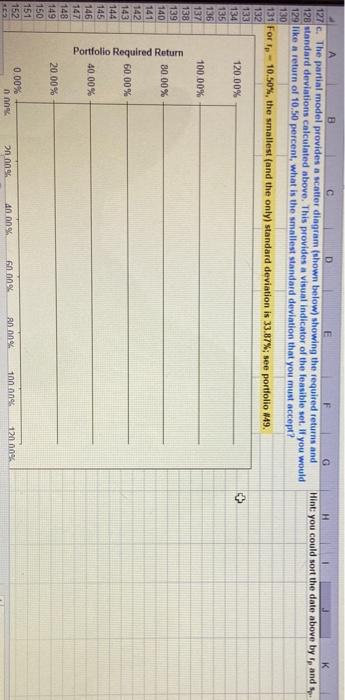


this is all the information i have for the assignment. 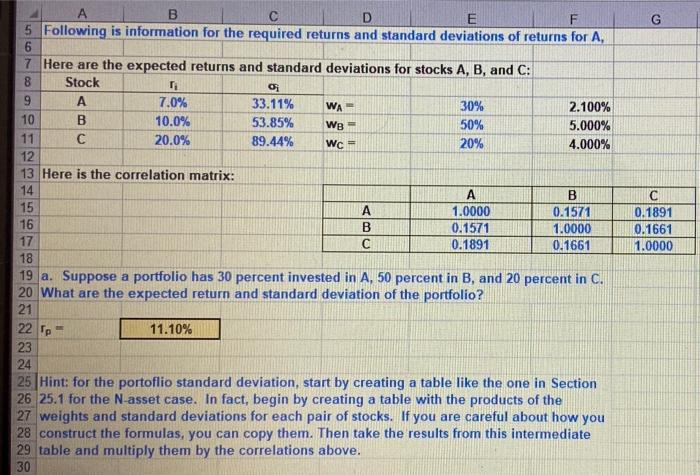
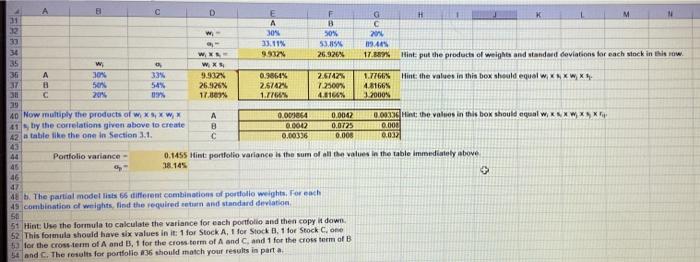
G op A B D E F 48 b. The partial model lists 66 different combinations of portfolio weights. For each 49 combination of weights, find the required return and standard deviation. 50 51 Hint: Use the formula to calculate the variance for each portfolio and then copy it down. 52 This formula should have six values in it: 1 for Stock A, 1 for Stock B, 1 for Stock C, one 53 for the cross term of A and B, 1 for the cross term of A and C, and 1 for the cross term of B 54 and C. The results for portfolio #36 should match your results in part a. 55 56 57 58 Portoflio # WA W8 Wc Variance 59 1 0.0 0.0 1.0 60 0.0 0.1 0.9 61 0.0 0.2 0.8 62 4 0.0 0.3 0.7 63 5 0.0 0.4 0.6 64 6 0.0 0.5 0.5 65 7 0.0 0.6 0.4 66 8 0.0 0.7 0.3 67 9 0.0 0.8 0.2 68 10 0.0 0.9 0.1 69 11 0.0 1.0 0.0 70 12 0.1 0.0 0.9 71 13 0.1 0.1 0.8 72 14 0.1 0.2 0.7 73 15 0.1 0.3 0.6 74 16 0 1 MA 05 COND E G B 0.1 0.1 0.1 0.1 0.1 0.1 74 75 76 77 78 79 80 81 82 83 84 85 86 87 88 89 90 91 92 93 94 95 96 97 98 99 100 A 16 17 18 19 20 21 22 23 24 25 26 27 28 29 30 31 32 33 34 35 36 37 38 39 40 41 12 0.2 0.2 0.2 0.2 0.2 0.2 0.2 0.2 0.2 0.3 0.3 0.3 0.3 0.3 0.4 0.5 0.6 0.7 0.8 0.9 0.0 0.1 0.2 0.3 0.4 0.5 0.6 0.7 0.8 0.0 0.1 0.2 0.3 0.4 0.5 0.6 D 0.5 0.4 0.3 0.2 0.1 0.0 0.8 0.7 0.6 0.5 0.4 0.3 0.2 0.1 0.0 0.7 0.6 0.5 0.3 0.7 0.3 0.3 0.4 0.4 0.4 NA 0.4 0.3 0.2 0.1 0.0 0.6 0.5 0.4 03 0.0 0.1 0.2 0.3 E F G B 0.4 0.4 0.4 100 101 102 103 104 105 106 107 108 109 110 111 + A 42 43 44 45 46 47 48 49 50 51 52 53 54 55 56 57 58 59 60 61 62 63 64 65 66 112 0.3 0.4 0.5 0.6 0.0 0.1 0.2 0.3 0.4 0.5 0.0 0.1 0.2 0.3 0.4 0.0 0.1 0.2 0.3 0.0 0.1 0.2 0.0 0.1 0.0 0.4 0.5 0.5 0.5 0.5 0.5 0.5 0.6 0.6 0.6 0.6 0.6 0.7 0.7 0.7 0.7 0.8 0.8 0.8 0.9 0.9 1.0 0.3 0.2 0.1 0.0 0.5 0.4 0.3 0.2 0.1 0.0 0.4 0.3 0.2 0.1 0.0 0.3 0.2 0.1 0.0 0.2 0.1 0.0 0.1 0.0 0.0 113 114 115 116 117 118 119 120 121 122 123 124 125 H Hint: you could sort the date above by to and Sp. B E 127. The partial model provides a scatter diagram (shown below) showing the required returns and 128 standard deviations calculated above. This provides a visual indicator of the feasible set. If you would 129 like a return of 10.50 percent, what is the smallest standard deviation that you must accept? 130 131 For - 10.50%, the smallest and the only) standard deviation is 33.87%; see portfolio 149. 132 133 134 120.00% 135 136 137 100.00% 138 139 140 80.00% 141 142 143 60.00% 144 145 146 40.00% 147 148 20.00% 150 151 152 0.00% 2009 40 na 60ng 80.00 100 nne 120.000 Portfolio Required Return 149 G o B D E F 5 Following is information for the required returns and standard deviations of returns for A, 6 7 Here are the expected returns and standard deviations for stocks A, B, and C: 8 Stock 9 A 7.0% 33.11% WA 30% 2.100% 10 B 10.0% 53.85% WB - 50% 5.000% 11 20.0% 89.44% Wc = 20% 4.000% 12 13 Here is the correlation matrix: 14 A B 15 1.0000 0.1571 16 B 0.1571 1.0000 17 0.1891 0.1661 18 19 a. Suppose a portfolio has 30 percent invested in A, 50 percent in B, and 20 percent in C. 20 What are the expected return and standard deviation of the portfolio? 21 22 p 11.10% 23 24 25 Hint: for the portoflio standard deviation, start by creating a table like the one in Section 26 25.1 for the N-asset case. In fact, begin by creating a table with the products of the 27 weights and standard deviations for each pair of stocks. If you are careful about how you 28 construct the formulas, you can copy them. Then take the results from this intermediate 29 table and multiply them by the correlations above. 30 0.1891 0.1661 1.0000 A B c D E F 11 H M A B C 32 w 30 30% 2014 30 33.11% 53.89 119.405 36 WW 9.33 26.926 17.389% Hint put the products of weights and standard deviations for each stock in New 35 w WS 36 A 30% 33% 9.937% 0.9864% 2.61425 1.77669 37 Hint: the values in thin box should equel W.XNXWXH B 50 54% 26.925 2.57424 7.2500% 4.8166% 2014 09% 17.30 1.7766% 4.8166% 12000% 19 40 Now multiply the products of WXS, W, X A 0.018 0.0042 0.00330 Hint the values in this bok should equal wiXWXK 41, by the correlations given above to create B 0.0012 0,0723 0.000 42 table like the one in Section 3.1. C 0.00336 0.008 0.033 43 44 Portfolio variance - 0.1455 Mint portfolio variance is the sum of all the values in the table immediately above 46 38.145 46 $ 47 8. The partial model liss 66 different combinations of portfolio weights. For each 45 combination of weights, find the required return and standard deviation 50 51 Hint Use the formula to calculate the variance for each portfolio and then copy it down. 52 This formula should have six values in it: 1 for Stock A, 1 for Stock 1.1 for Stock C, on 5 for the crosster of A and B, 1 for the cross term of A and Cand 1 for the cross form of B 54 and C. The results for portfolio #36 should match your results in parta G op A B D E F 48 b. The partial model lists 66 different combinations of portfolio weights. For each 49 combination of weights, find the required return and standard deviation. 50 51 Hint: Use the formula to calculate the variance for each portfolio and then copy it down. 52 This formula should have six values in it: 1 for Stock A, 1 for Stock B, 1 for Stock C, one 53 for the cross term of A and B, 1 for the cross term of A and C, and 1 for the cross term of B 54 and C. The results for portfolio #36 should match your results in part a. 55 56 57 58 Portoflio # WA W8 Wc Variance 59 1 0.0 0.0 1.0 60 0.0 0.1 0.9 61 0.0 0.2 0.8 62 4 0.0 0.3 0.7 63 5 0.0 0.4 0.6 64 6 0.0 0.5 0.5 65 7 0.0 0.6 0.4 66 8 0.0 0.7 0.3 67 9 0.0 0.8 0.2 68 10 0.0 0.9 0.1 69 11 0.0 1.0 0.0 70 12 0.1 0.0 0.9 71 13 0.1 0.1 0.8 72 14 0.1 0.2 0.7 73 15 0.1 0.3 0.6 74 16 0 1 MA 05 COND E G B 0.1 0.1 0.1 0.1 0.1 0.1 74 75 76 77 78 79 80 81 82 83 84 85 86 87 88 89 90 91 92 93 94 95 96 97 98 99 100 A 16 17 18 19 20 21 22 23 24 25 26 27 28 29 30 31 32 33 34 35 36 37 38 39 40 41 12 0.2 0.2 0.2 0.2 0.2 0.2 0.2 0.2 0.2 0.3 0.3 0.3 0.3 0.3 0.4 0.5 0.6 0.7 0.8 0.9 0.0 0.1 0.2 0.3 0.4 0.5 0.6 0.7 0.8 0.0 0.1 0.2 0.3 0.4 0.5 0.6 D 0.5 0.4 0.3 0.2 0.1 0.0 0.8 0.7 0.6 0.5 0.4 0.3 0.2 0.1 0.0 0.7 0.6 0.5 0.3 0.7 0.3 0.3 0.4 0.4 0.4 NA 0.4 0.3 0.2 0.1 0.0 0.6 0.5 0.4 03 0.0 0.1 0.2 0.3 E F G B 0.4 0.4 0.4 100 101 102 103 104 105 106 107 108 109 110 111 + A 42 43 44 45 46 47 48 49 50 51 52 53 54 55 56 57 58 59 60 61 62 63 64 65 66 112 0.3 0.4 0.5 0.6 0.0 0.1 0.2 0.3 0.4 0.5 0.0 0.1 0.2 0.3 0.4 0.0 0.1 0.2 0.3 0.0 0.1 0.2 0.0 0.1 0.0 0.4 0.5 0.5 0.5 0.5 0.5 0.5 0.6 0.6 0.6 0.6 0.6 0.7 0.7 0.7 0.7 0.8 0.8 0.8 0.9 0.9 1.0 0.3 0.2 0.1 0.0 0.5 0.4 0.3 0.2 0.1 0.0 0.4 0.3 0.2 0.1 0.0 0.3 0.2 0.1 0.0 0.2 0.1 0.0 0.1 0.0 0.0 113 114 115 116 117 118 119 120 121 122 123 124 125 H Hint: you could sort the date above by to and Sp. B E 127. The partial model provides a scatter diagram (shown below) showing the required returns and 128 standard deviations calculated above. This provides a visual indicator of the feasible set. If you would 129 like a return of 10.50 percent, what is the smallest standard deviation that you must accept? 130 131 For - 10.50%, the smallest and the only) standard deviation is 33.87%; see portfolio 149. 132 133 134 120.00% 135 136 137 100.00% 138 139 140 80.00% 141 142 143 60.00% 144 145 146 40.00% 147 148 20.00% 150 151 152 0.00% 2009 40 na 60ng 80.00 100 nne 120.000 Portfolio Required Return 149 G o B D E F 5 Following is information for the required returns and standard deviations of returns for A, 6 7 Here are the expected returns and standard deviations for stocks A, B, and C: 8 Stock 9 A 7.0% 33.11% WA 30% 2.100% 10 B 10.0% 53.85% WB - 50% 5.000% 11 20.0% 89.44% Wc = 20% 4.000% 12 13 Here is the correlation matrix: 14 A B 15 1.0000 0.1571 16 B 0.1571 1.0000 17 0.1891 0.1661 18 19 a. Suppose a portfolio has 30 percent invested in A, 50 percent in B, and 20 percent in C. 20 What are the expected return and standard deviation of the portfolio? 21 22 p 11.10% 23 24 25 Hint: for the portoflio standard deviation, start by creating a table like the one in Section 26 25.1 for the N-asset case. In fact, begin by creating a table with the products of the 27 weights and standard deviations for each pair of stocks. If you are careful about how you 28 construct the formulas, you can copy them. Then take the results from this intermediate 29 table and multiply them by the correlations above. 30 0.1891 0.1661 1.0000 A B c D E F 11 H M A B C 32 w 30 30% 2014 30 33.11% 53.89 119.405 36 WW 9.33 26.926 17.389% Hint put the products of weights and standard deviations for each stock in New 35 w WS 36 A 30% 33% 9.937% 0.9864% 2.61425 1.77669 37 Hint: the values in thin box should equel W.XNXWXH B 50 54% 26.925 2.57424 7.2500% 4.8166% 2014 09% 17.30 1.7766% 4.8166% 12000% 19 40 Now multiply the products of WXS, W, X A 0.018 0.0042 0.00330 Hint the values in this bok should equal wiXWXK 41, by the correlations given above to create B 0.0012 0,0723 0.000 42 table like the one in Section 3.1. C 0.00336 0.008 0.033 43 44 Portfolio variance - 0.1455 Mint portfolio variance is the sum of all the values in the table immediately above 46 38.145 46 $ 47 8. The partial model liss 66 different combinations of portfolio weights. For each 45 combination of weights, find the required return and standard deviation 50 51 Hint Use the formula to calculate the variance for each portfolio and then copy it down. 52 This formula should have six values in it: 1 for Stock A, 1 for Stock 1.1 for Stock C, on 5 for the crosster of A and B, 1 for the cross term of A and Cand 1 for the cross form of B 54 and C. The results for portfolio #36 should match your results in parta 

Step by Step Solution
There are 3 Steps involved in it
Step: 1

Get Instant Access to Expert-Tailored Solutions
See step-by-step solutions with expert insights and AI powered tools for academic success
Step: 2

Step: 3

Ace Your Homework with AI
Get the answers you need in no time with our AI-driven, step-by-step assistance
Get Started


