I need answer
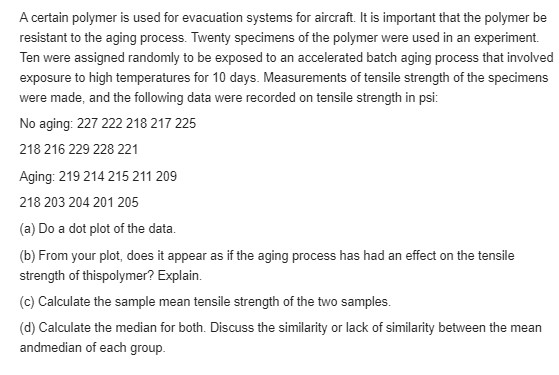
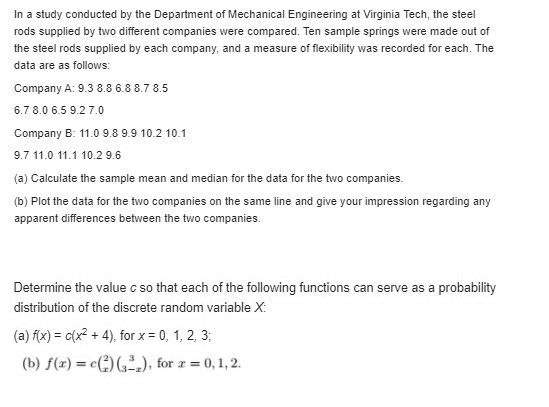
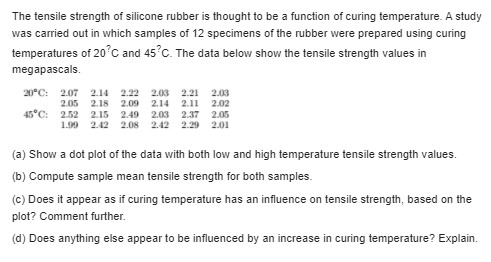
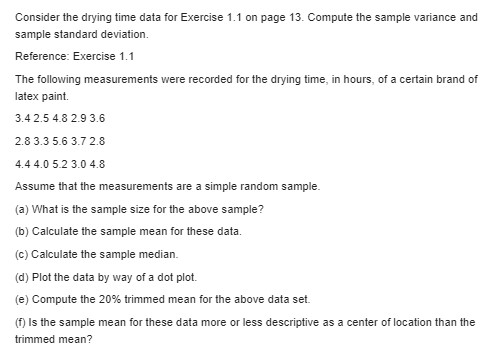
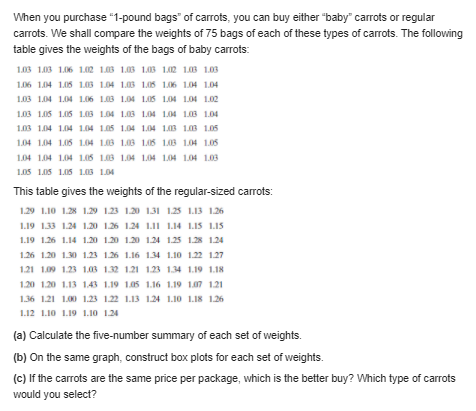
A certain polymer is used for evacuation systems for aircraft. It is important that the polymer be resistant to the aging process. Twenty specimens of the polymer were used in an experiment. Ten were assigned randomly to be exposed to an accelerated batch aging process that involved exposure to high temperatures for 10 days. Measurements of tensile strength of the specimens were made, and the following data were recorded on tensile strength in psi: No aging: 227 222 218 217 225 218 216 229 228 221 Aging: 219 214 215 211 209 218 203 204 201 205 (a) Do a dot plot of the data. (b) From your plot, does it appear as if the aging process has had an effect on the tensile strength of thispolymer? Explain. (c) Calculate the sample mean tensile strength of the two samples. (d) Calculate the median for both. Discuss the similarity or lack of similarity between the mean andmedian of each group.In a study conducted by the Department of Mechanical Engineering at Virginia Tech, the steel rods supplied by two different companies were compared. Ten sample springs were made out of the steel rods supplied by each company, and a measure of flexibility was recorded for each. The data are as follows: Company A: 9.3 8.8 6.8 8.7 8.5 6.78.0659.27.0 Company B: 11.0 9.8 9.9 10.2 10.1 9.7 11.0 11.1 10.2 9.6 (a) Calculate the sample mean and median for the data for the two companies. (b) Plot the data for the two companies on the same line and give your impression regarding any apparent differences between the two companies. Determine the value c so that each of the following functions can serve as a probability distribution of the discrete random variable X: (a) f(x) = c(xz + 4), for x = 0, 1, 2, 3; (b) f(x) = c() (2), for x = 0, 1, 2.The tensile strength of silicone rubber is thought to be a function of curing temperature. A study was carried out in which samples of 12 specimens of the rubber were prepared using curing temperatures of 20 C and 45 C. The data below show the tensile strength values in megapascals. 20"C: 207 2.14 2.03 2.21 2.03 2.05 2. 18 2.09 2.14 2.11 2.02 45"C: 2.02 2.15 2.49 2.03 2.37 2.05 1.09 2.42 2.08 2.12 2.29 2.01 (a) Show a dot plot of the data with both low and high temperature tensile strength values. (b) Compute sample mean tensile strength for both samples. (c) Does it appear as if curing temperature has an influence on tensile strength, based on the plot? Comment further. (d) Does anything else appear to be influenced by an increase in curing temperature? Explain.Consider the drying time data for Exercise 1.1 on page 13. Compute the sample variance and sample standard deviation. Reference: Exercise 1.1 The following measurements were recorded for the drying time, in hours, of a certain brand of latex paint. 3.4 2.5 4.8 2.9 3.6 2.8 3.3 5.6 3.72.8 4.4 4.0 5.2 3.0 4.8 Assume that the measurements are a simple random sample. (a) What is the sample size for the above sample? (b) Calculate the sample mean for these data. (c) Calculate the sample median. (d) Plot the data by way of a dot plot. (e) Compute the 20% trimmed mean for the above data set. (f) Is the sample mean for these data more or less descriptive as a center of location than the trimmed mean?\fReferring to Exercise 3.38, find (a) the marginal distribution of X; (b) the marginal distribution of Y. Reference: Exercise 3.38: If the joint probability distribution of X and Yis given by Ax, V)= an for x = 0, 1, 2, 3; y = 0, 1, 2, find a) P(X $ 2, Y= 1); b) P(X >2, Y= 1); c) (c) P(X >Y):(d) P(X + Y = 4). A coin is flipped until 3 heads in succession occur. List only those elements of the sample space that require 6 or less tosses. Is this a discrete sample space? Explain.Construct a graph of the cumulative distribution function of Exercise 3. 15. Reference: Exercise 3.15: Find the cumulative distribution function of the random variable X representing the number of defectives in Exercise 3.11. Then using F(x), find (a) P(X = 1); (b) P(0