Answered step by step
Verified Expert Solution
Question
1 Approved Answer
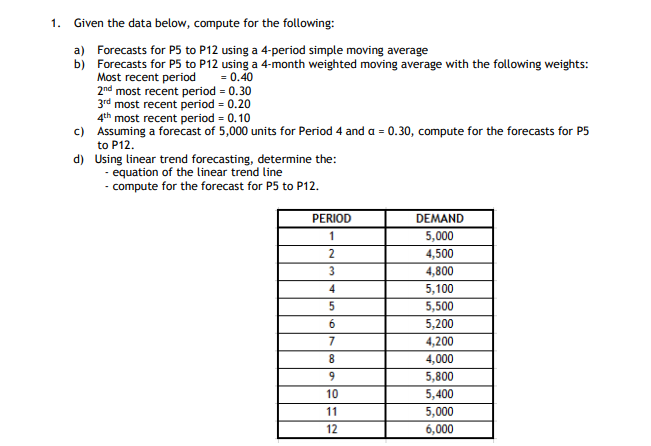
i need asap answers plz 1. Given the data below, compute for the following: a) Forecasts for P5 to P12 using a 4-period simple moving


i need asap answers plz
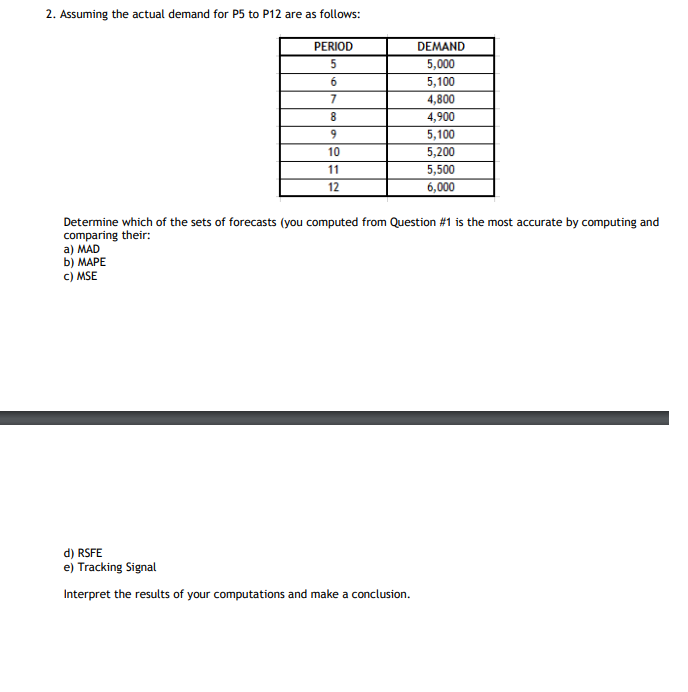
1. Given the data below, compute for the following: a) Forecasts for P5 to P12 using a 4-period simple moving average b) Forecasts for P5 to P12 using a 4-month weighted moving average with the following weights: Most recent period = 0.40 2nd most recent period = 0.30 3rd most recent period = 0.20 4th most recent period = 0.10 Assuming a forecast of 5,000 units for Period 4 and a = 0.30, compute for the forecasts for P5 to P12. d) Using linear trend forecasting, determine the: - equation of the linear trend line - compute for the forecast for P5 to P12. PERIOD 1 5 2 DEMAND ,000 4,500 4,800 5,100 5,500 5,200 4,200 4,000 5,800 5,400 ,000 6,000 7 10 115 12 2. Assuming the actual demand for P5 to P12 are as follows: PERIOD DEMAND 5,000 5,100 4,800 4,900 5,100 5,200 5,500 6,000 10 11 Determine which of the sets of forecasts (you computed from Question #1 is the most accurate by computing and comparing their: a) MAD b) MAPE c) MSE d) RSFE e) Tracking Signal Interpret the results of your computations and make a conclusion. 1. Given the data below, compute for the following: a) Forecasts for P5 to P12 using a 4-period simple moving average b) Forecasts for P5 to P12 using a 4-month weighted moving average with the following weights: Most recent period = 0.40 2nd most recent period = 0.30 3rd most recent period = 0.20 4th most recent period = 0.10 Assuming a forecast of 5,000 units for Period 4 and a = 0.30, compute for the forecasts for P5 to P12. d) Using linear trend forecasting, determine the: - equation of the linear trend line - compute for the forecast for P5 to P12. PERIOD 1 5 2 DEMAND ,000 4,500 4,800 5,100 5,500 5,200 4,200 4,000 5,800 5,400 ,000 6,000 7 10 115 12 2. Assuming the actual demand for P5 to P12 are as follows: PERIOD DEMAND 5,000 5,100 4,800 4,900 5,100 5,200 5,500 6,000 10 11 Determine which of the sets of forecasts (you computed from Question #1 is the most accurate by computing and comparing their: a) MAD b) MAPE c) MSE d) RSFE e) Tracking Signal Interpret the results of your computations and make a conclusionStep by Step Solution
There are 3 Steps involved in it
Step: 1

Get Instant Access to Expert-Tailored Solutions
See step-by-step solutions with expert insights and AI powered tools for academic success
Step: 2

Step: 3

Ace Your Homework with AI
Get the answers you need in no time with our AI-driven, step-by-step assistance
Get Started


